Copyright
©2006 Baishideng Publishing Group Co.
World J Gastroenterol. Jun 7, 2006; 12(21): 3359-3367
Published online Jun 7, 2006. doi: 10.3748/wjg.v12.i21.3359
Published online Jun 7, 2006. doi: 10.3748/wjg.v12.i21.3359
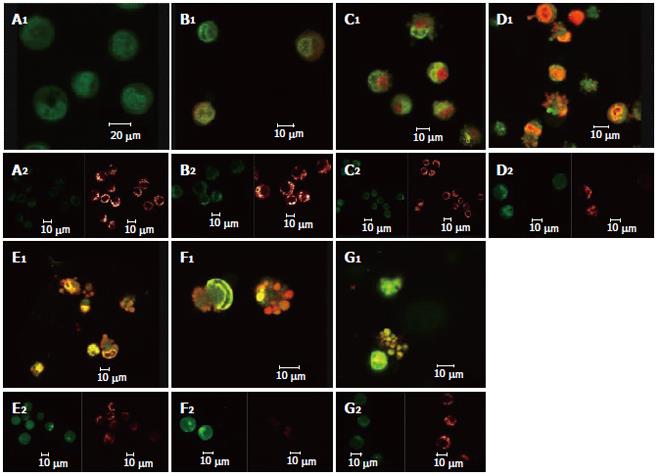
Figure 5 Changes induced by solanine in cell morphology, [Ca2+]i in cells, and membrane potential of mitochondria in HepG2 cells in the process of apoptosis.
A: Control; B: 0.0032 μg/mL solanine; C: 0.016 μg/mL solanine; D: 0.08 μg/mL solanine; E: 0.4 μg/mL solanine; F: 2 μg/mL solanine; G: 0.08 μg/mL camptothecin.
- Citation: Gao SY, Wang QJ, Ji YB. Effect of solanine on the membrane potential of mitochondria in HepG2 cells and [Ca2+]i in the cells. World J Gastroenterol 2006; 12(21): 3359-3367
- URL: https://www.wjgnet.com/1007-9327/full/v12/i21/3359.htm
- DOI: https://dx.doi.org/10.3748/wjg.v12.i21.3359


