Copyright
©2006 Baishideng Publishing Group Co.
World J Gastroenterol. Jun 7, 2006; 12(21): 3352-3358
Published online Jun 7, 2006. doi: 10.3748/wjg.v12.i21.3352
Published online Jun 7, 2006. doi: 10.3748/wjg.v12.i21.3352
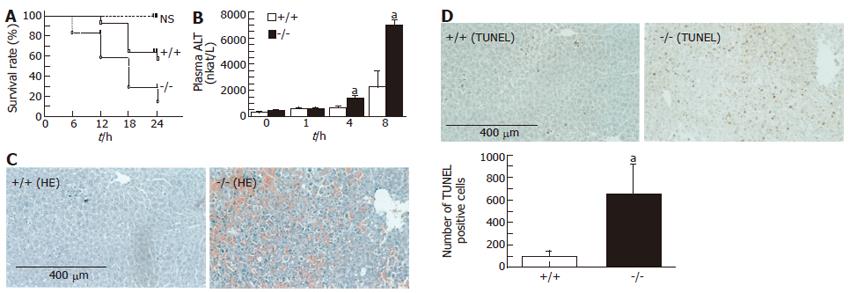
Figure 1 GalN/LPS induced changes in mice.
A: Survival rate (n = 10); B: Plasma ALT (mean ± SE, n = 6). aP < 0.05, bP < 0.01, vs WT; C: Histology of the liver. Massive liver injury in adiponectin-/- mice. (Hematoxylin-eosin × 100); D: Large numbers of apoptotic hepatocytes in adiponectin-/- mice (TUNEL × 100). Scale bar = 400 μm. aP < 0.05, vs WT mice.
- Citation: Matsumoto H, Tamura S, Kamada Y, Kiso S, Fukushima J, Wada A, Maeda N, Kihara S, Funahashi T, Matsuzawa Y, Shimomura I, Hayashi N. Adiponectin deficiency exacerbates lipopolysaccharide/D-galactosamine-induced liver injury in mice. World J Gastroenterol 2006; 12(21): 3352-3358
- URL: https://www.wjgnet.com/1007-9327/full/v12/i21/3352.htm
- DOI: https://dx.doi.org/10.3748/wjg.v12.i21.3352


