Copyright
©2006 Baishideng Publishing Group Co.
World J Gastroenterol. Jun 7, 2006; 12(21): 3344-3351
Published online Jun 7, 2006. doi: 10.3748/wjg.v12.i21.3344
Published online Jun 7, 2006. doi: 10.3748/wjg.v12.i21.3344
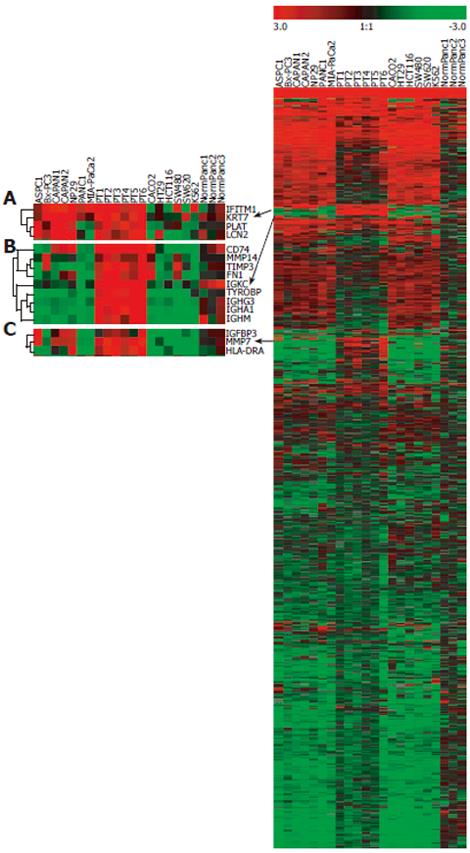
Figure 2 Hierarchical clustering analysis of gene expression profiles.
Right: Expression profile of the 871 genes retained after data-filtering. Left: Three magnified subclusters (A-C) showing the genes overexpressed in most of pancreatic tumors. Red color indicates high expression levels; green color indicates low expression levels.
- Citation: Laurell H, Bouisson M, Berthelémy P, Rochaix P, Déjean S, Besse P, Susini C, Pradayrol L, Vaysse N, Buscail L. Identification of biomarkers of human pancreatic adenocarcinomas by expression profiling and validation with gene expression analysis in endoscopic ultrasound-guided fine needle aspiration samples. World J Gastroenterol 2006; 12(21): 3344-3351
- URL: https://www.wjgnet.com/1007-9327/full/v12/i21/3344.htm
- DOI: https://dx.doi.org/10.3748/wjg.v12.i21.3344


