Copyright
©2006 Baishideng Publishing Group Co.
World J Gastroenterol. Jan 14, 2006; 12(2): 271-279
Published online Jan 14, 2006. doi: 10.3748/wjg.v12.i2.271
Published online Jan 14, 2006. doi: 10.3748/wjg.v12.i2.271
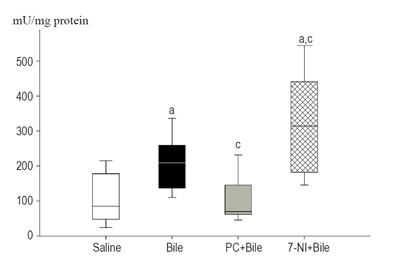
Figure 3 Myeloperoxidase (MPO) activity in the esophageal mucosa 180 min after treatment.
The plots demonstrate the median (horizontal line in the box), the 25th (lower whisker) and 75th (upper whisker) percentiles, respectively. aP < 0.05 between groups vs saline-treated control group values. cP < 0.05 between bile+7-NI-treated and bile+PC-treated groups vs bile-treated group values.
- Citation: Eros G, Kaszaki J, Czobel M, Boros M. Systemic phosphatidylcholine pretreatment protects canine esophageal mucosa during acute experimental biliary reflux. World J Gastroenterol 2006; 12(2): 271-279
- URL: https://www.wjgnet.com/1007-9327/full/v12/i2/271.htm
- DOI: https://dx.doi.org/10.3748/wjg.v12.i2.271


