Copyright
©2006 Baishideng Publishing Group Co.
World J Gastroenterol. Jan 14, 2006; 12(2): 271-279
Published online Jan 14, 2006. doi: 10.3748/wjg.v12.i2.271
Published online Jan 14, 2006. doi: 10.3748/wjg.v12.i2.271
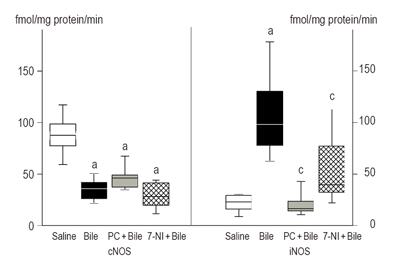
Figure 2 Changes in constitutive (left panel) and inducible NOS (right panel) activities [fmol (mg protein)-1/min] in esophageal tissue from saline-treated (empty box), bile-treated (black box), bile+PC-treated (gray box) and bile+7-NI-treated (checked box) animals.
The plots demonstrate the median (horizontal line in the box), the 25th (lower whisker) and 75th (upper whisker) percentiles, respectively. aP < 0.05 between groups vs saline-treated control group values. cP < 0.05 between bile+7-NI-treated and bile+PC-treated groups vs bile-treated group values.
- Citation: Eros G, Kaszaki J, Czobel M, Boros M. Systemic phosphatidylcholine pretreatment protects canine esophageal mucosa during acute experimental biliary reflux. World J Gastroenterol 2006; 12(2): 271-279
- URL: https://www.wjgnet.com/1007-9327/full/v12/i2/271.htm
- DOI: https://dx.doi.org/10.3748/wjg.v12.i2.271


