Copyright
©2006 Baishideng Publishing Group Co.
World J Gastroenterol. May 21, 2006; 12(19): 3050-3054
Published online May 21, 2006. doi: 10.3748/wjg.v12.i19.3050
Published online May 21, 2006. doi: 10.3748/wjg.v12.i19.3050
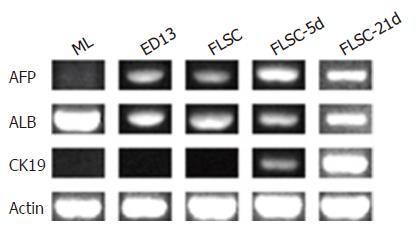
Figure 5 Hepato- and cholangiocyte- specific gene expressions of liver cells.
The mRNA was prepared and RT-PCRs were performed for the genes displayed in the figure in each cell subset. β-actin (Actin) gene expression was used as controls for mRNA content per sample. A representative experiment for all the gene expressions of a total of three independent ones is shown. ML, mature mouse liver cells; ED13, ED 13 mouse fetal liver cells; FLSC, fetal liver stem cells [c-Kit-(CD45/TER119)- cells]; FLSC-5d, FLSC cultured for 5 d; FLSC-21d, FLSC cultured for 21 d.
- Citation: He YF, Liu YK, Gao DM, Chen J, Yang PY. An efficient method of sorting liver stem cells by using immuno-magnetic microbeads. World J Gastroenterol 2006; 12(19): 3050-3054
- URL: https://www.wjgnet.com/1007-9327/full/v12/i19/3050.htm
- DOI: https://dx.doi.org/10.3748/wjg.v12.i19.3050


