Copyright
©2006 Baishideng Publishing Group Co.
World J Gastroenterol. May 14, 2006; 12(18): 2864-2869
Published online May 14, 2006. doi: 10.3748/wjg.v12.i18.2864
Published online May 14, 2006. doi: 10.3748/wjg.v12.i18.2864
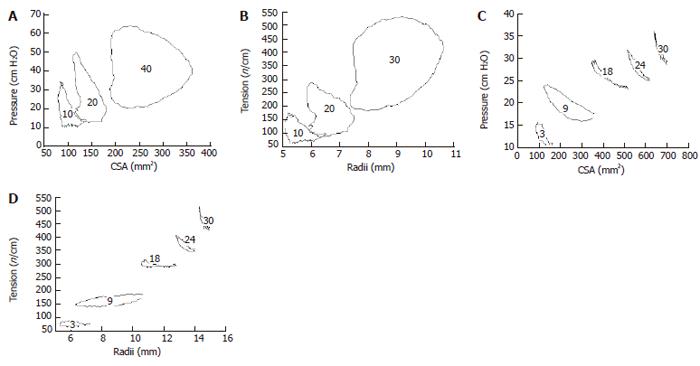
Figure 6 Pressure-CSA and tension-radius relations during esophagus contractions (A, B) and during duodenum contractions (C, D).
The numbers in the figures indicate the volume in ml.
- Citation: Gregersen H, Liao D. New perspectives of studying gastrointestinal muscle function. World J Gastroenterol 2006; 12(18): 2864-2869
- URL: https://www.wjgnet.com/1007-9327/full/v12/i18/2864.htm
- DOI: https://dx.doi.org/10.3748/wjg.v12.i18.2864


