Copyright
©2006 Baishideng Publishing Group Co.
World J Gastroenterol. May 14, 2006; 12(18): 2864-2869
Published online May 14, 2006. doi: 10.3748/wjg.v12.i18.2864
Published online May 14, 2006. doi: 10.3748/wjg.v12.i18.2864
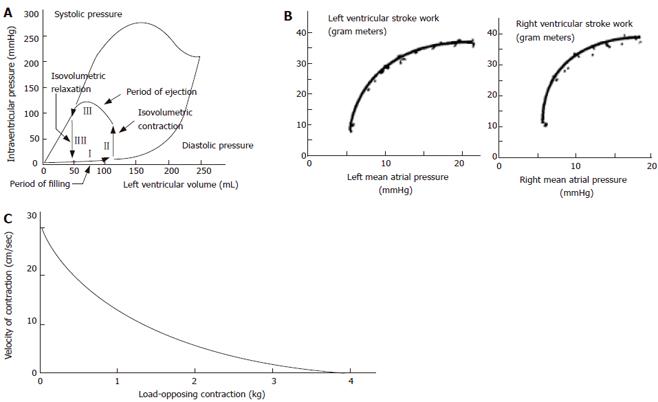
Figure 1 A: Relationship between left ventricular volume and pressure during diastole and systole.
The arrows indicate the four phases of the volume-pressure diagram during the normal cardiac cycle; B: Ventricular function curves expressing the Frank-Starling mechanism of the heart, i.e. the intrinsic ability of the heart to adapt to changing volumes of inflowing blood; C: Schematic plot of shortening velocity vs force. The relationship has in muscle tissues shown to be hyperbolic. The y-intercept is called Vmax which reflects the maximum crossbridge turnover rate. The x-intercept is the peak isometric force, Fmax, which is determined by the number of attached crossbridges (Modified from Guyton and Hall 2002 and others).
- Citation: Gregersen H, Liao D. New perspectives of studying gastrointestinal muscle function. World J Gastroenterol 2006; 12(18): 2864-2869
- URL: https://www.wjgnet.com/1007-9327/full/v12/i18/2864.htm
- DOI: https://dx.doi.org/10.3748/wjg.v12.i18.2864


