Copyright
©2006 Baishideng Publishing Group Co.
World J Gastroenterol. May 14, 2006; 12(18): 2839-2845
Published online May 14, 2006. doi: 10.3748/wjg.v12.i18.2839
Published online May 14, 2006. doi: 10.3748/wjg.v12.i18.2839
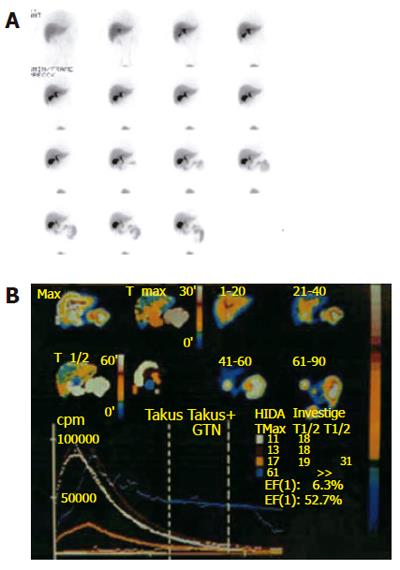
Figure 3 Hepatobiliary scintigraphy.
A: Pictures at different time windows; B: Time activity curves are shown for different regions of interest.
- Citation: Funch-Jensen P, Drewes AM, Madácsy L. Evaluation of the biliary tract in patients with functional biliary symptoms. World J Gastroenterol 2006; 12(18): 2839-2845
- URL: https://www.wjgnet.com/1007-9327/full/v12/i18/2839.htm
- DOI: https://dx.doi.org/10.3748/wjg.v12.i18.2839


