Copyright
©2006 Baishideng Publishing Group Co.
World J Gastroenterol. May 14, 2006; 12(18): 2818-2824
Published online May 14, 2006. doi: 10.3748/wjg.v12.i18.2818
Published online May 14, 2006. doi: 10.3748/wjg.v12.i18.2818
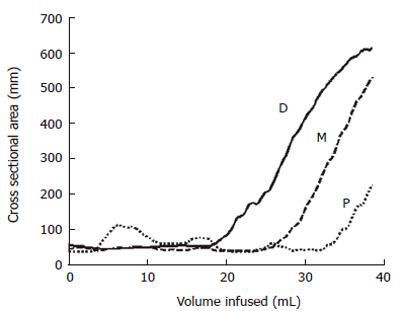
Figure 3 Plot showing the changes in the CSAs at the proximal (P), middle (M) and distal (D) electrode pairs as the balloon is distended at a constant flow rate indicated by the increase in volume.
- Citation: McMahon BP, Drewes AM, Gregersen H. Functional oesophago-gastric junction imaging. World J Gastroenterol 2006; 12(18): 2818-2824
- URL: https://www.wjgnet.com/1007-9327/full/v12/i18/2818.htm
- DOI: https://dx.doi.org/10.3748/wjg.v12.i18.2818


