Copyright
©2006 Baishideng Publishing Group Co.
World J Gastroenterol. May 7, 2006; 12(17): 2773-2778
Published online May 7, 2006. doi: 10.3748/wjg.v12.i17.2773
Published online May 7, 2006. doi: 10.3748/wjg.v12.i17.2773
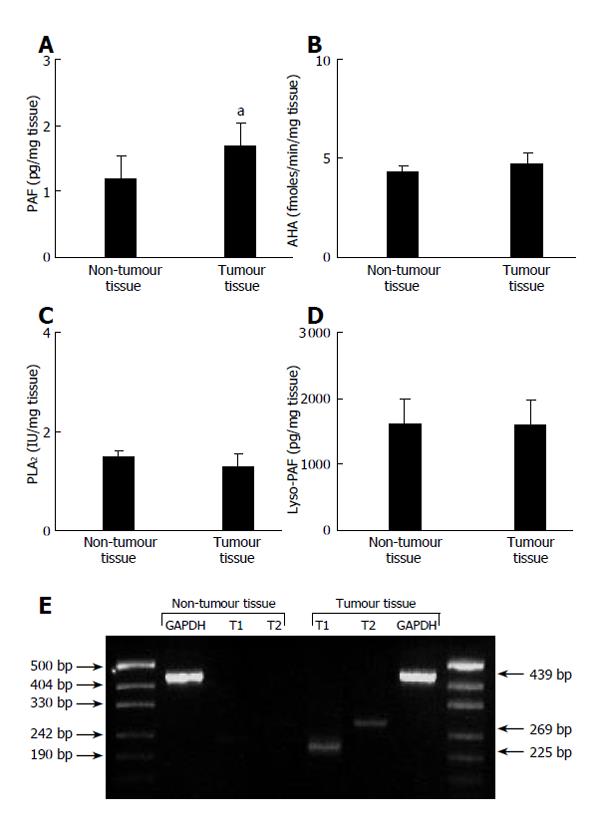
Figure 2 PAF, lyso-PAF, AHA, PLA2 levels and PAF-R transcripts in HCC and non-tumour tissues.
Upper panel shows specimens from 21 HCC patients obtained during the surgical procedure. A: PAF, aP < 0.05 vs non-tumour tissue; B: AHA (P = 0.24); C: PLA2 (P = 0.26); D: Lyso-PAF (P = 0.48). Statistical analysis was performed using the Students’ t-test for paired samples. Results are expressed as mean ± SE. Lower panel shows PAF-R transcripts determined by RT-PCR. Expected sizes of amplified products were 225 bp (PAF-R transcript 1), 269 bp (PAF-R transcript 2), 351 bp (spliced variant of PAF-R transcript 2), and 439 bp (GAPDG). Sizes of PCR products and DNA size ladder are indicated by arrows. All experiments were performed in triplicate.
- Citation: Mathonnet M, Descottes B, Valleix D, Truffinet V, Labrousse F, Denizot Y. Platelet-activating factor in cirrhotic liver and hepatocellular carcinoma. World J Gastroenterol 2006; 12(17): 2773-2778
- URL: https://www.wjgnet.com/1007-9327/full/v12/i17/2773.htm
- DOI: https://dx.doi.org/10.3748/wjg.v12.i17.2773


