Copyright
©2006 Baishideng Publishing Group Co.
World J Gastroenterol. Apr 14, 2006; 12(14): 2187-2194
Published online Apr 14, 2006. doi: 10.3748/wjg.v12.i14.2187
Published online Apr 14, 2006. doi: 10.3748/wjg.v12.i14.2187
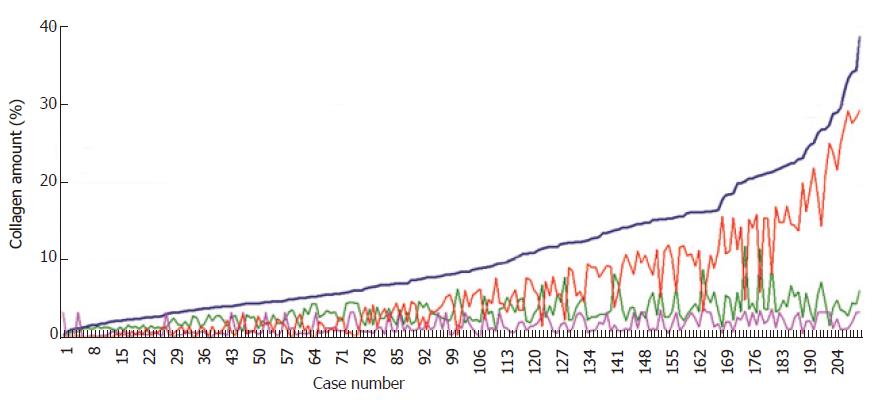
Figure 4 Comparative analysis of Markovian sequence of the amount of fibrosis, and the three sequences expressing the classes of magnitude of the collagen islets identified in 209 needle biopsy specimens.
(1). Markovian sequence of the total amount of fibrosis in a histological biopsy section (blue line); (2). Percentage of collagen islets with a magnitude of 104-106μm2 (red line); (3). Percentage of collagen islets with a magnitude of 103-104μm2 (fuchsia line); (4). Percentage of collagen islets with a magnitude of 101-103μm2 (green line).
- Citation: Dioguardi N, Grizzi F, Franceschini B, Bossi P, Russo C. Liver fibrosis and tissue architectural change measurement using fractal-rectified metrics and Hurst’s exponent. World J Gastroenterol 2006; 12(14): 2187-2194
- URL: https://www.wjgnet.com/1007-9327/full/v12/i14/2187.htm
- DOI: https://dx.doi.org/10.3748/wjg.v12.i14.2187


