Copyright
©2006 Baishideng Publishing Group Co.
World J Gastroenterol. Apr 7, 2006; 12(13): 2016-2023
Published online Apr 7, 2006. doi: 10.3748/wjg.v12.i13.2016
Published online Apr 7, 2006. doi: 10.3748/wjg.v12.i13.2016
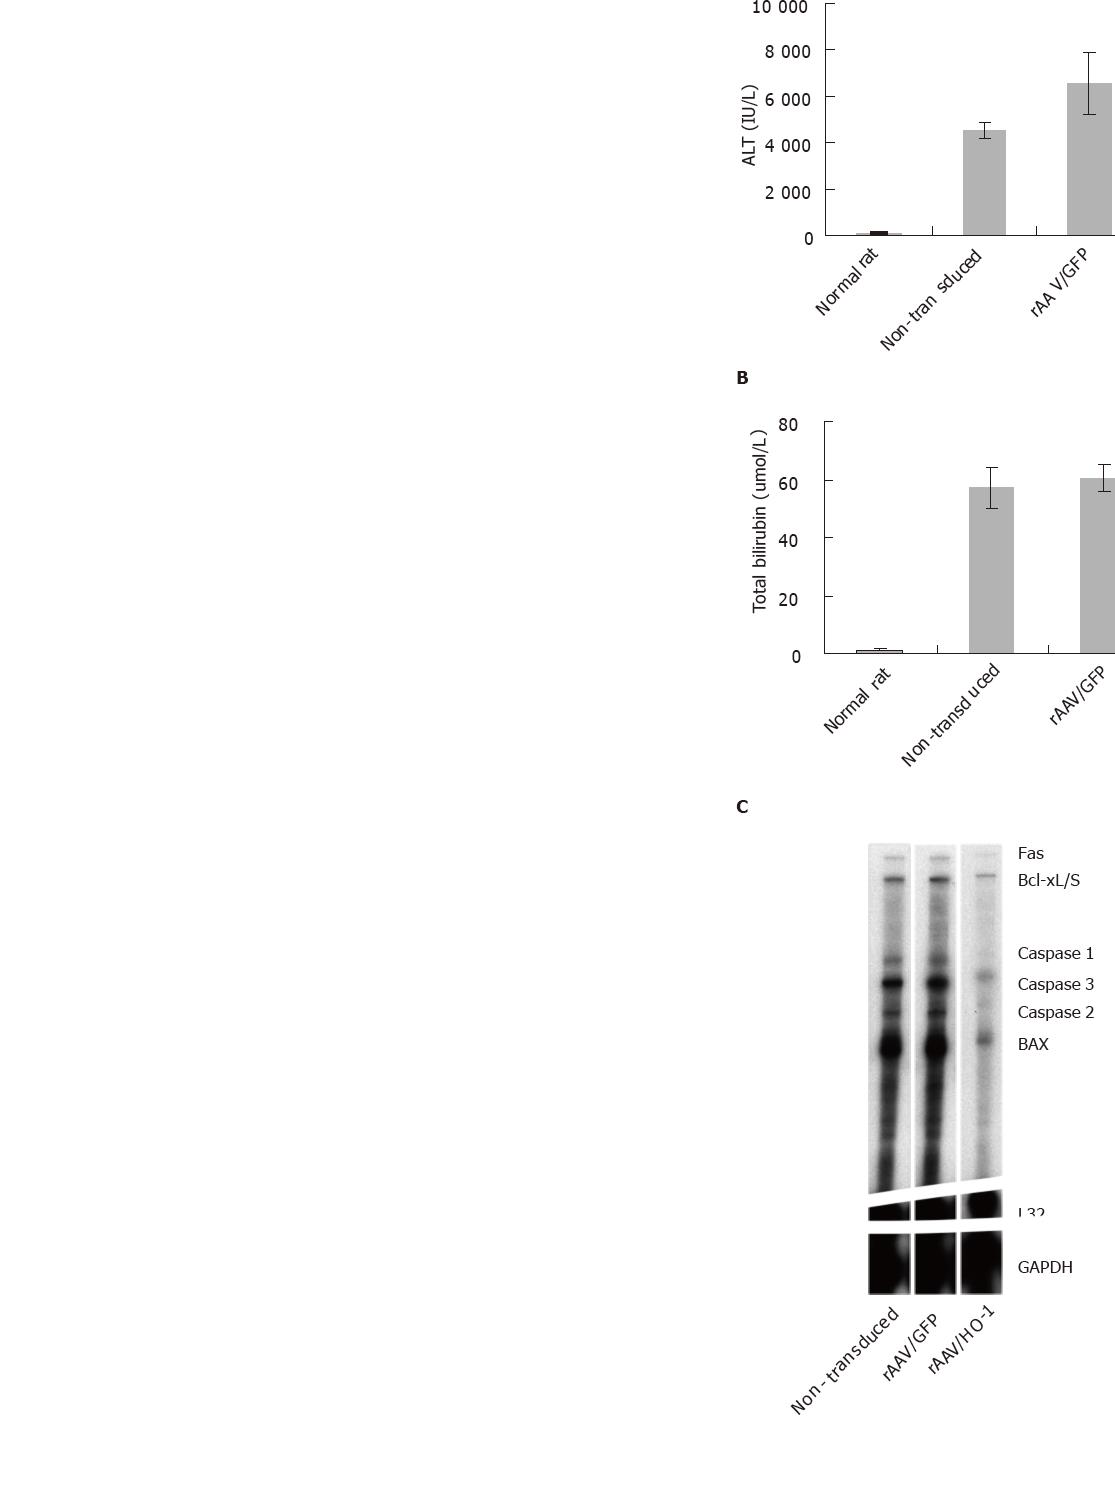
Figure 3 A and B: The liver function of rats with or with treatment under long-term CCl4 toxicity was presented by the determination of plasma ALT and total bilirubin level.
The data was shown as mean±SEM, n = 5-10, aP<0.001; C and D: The representative picture of the expression patterns of apoptotic genes in the livers at the 10th week. The mRNA level of genes was detected by RNase protection assay. The quantification of the expression level was measured by phosphoimager as described in Materials & Methods. The data were shown as mean ± SE, n = 3-5, bP<0.05; E: The ATP level of the livers of rats with or without treatments at the 10th wk, n = 5-10, dP<0.001.
- Citation: Tsui TY, Lau CK, Ma J, Glockzin G, Obed A, Schlitt HJ, Fan ST. Adeno-associated virus-mediated heme oxygenase-1 gene transfer suppresses the progression of micronodular cirrhosis in rats. World J Gastroenterol 2006; 12(13): 2016-2023
- URL: https://www.wjgnet.com/1007-9327/full/v12/i13/2016.htm
- DOI: https://dx.doi.org/10.3748/wjg.v12.i13.2016


