Copyright
©2006 Baishideng Publishing Group Co.
World J Gastroenterol. Apr 7, 2006; 12(13): 2016-2023
Published online Apr 7, 2006. doi: 10.3748/wjg.v12.i13.2016
Published online Apr 7, 2006. doi: 10.3748/wjg.v12.i13.2016
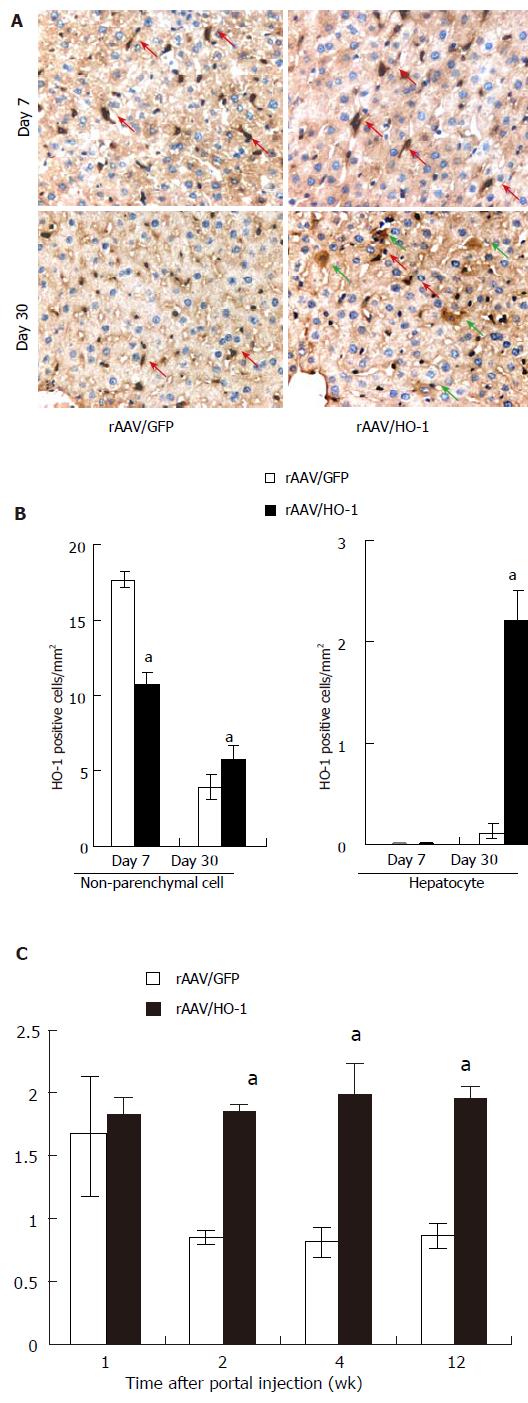
Figure 1 A: The expression patterns of HO-1 in the livers after portal injection of rAAV/HO-1 in LEW rats.
Red arrow indicated the HO-1-positive non-parenchymal cells; green arrow indicated the hepatocyte; B: The quantification of the HO-1 positive cells in the liver after administration of rAAV/HO-1. Data were presented as number of HO-1 positive cells per mm2; n = 3-5, mean ± SE, aP<0.05; C: The HO enzymatic activity of rAAV/GFP or rAAV/HO-1 transduced livers. The data were demonstrated as the amount of generated bilirubin of microsomal protein from liver tissues and were shown as the fold changes over the normal rat liver, mean ± SE, n = 3, aP < 0.05.
- Citation: Tsui TY, Lau CK, Ma J, Glockzin G, Obed A, Schlitt HJ, Fan ST. Adeno-associated virus-mediated heme oxygenase-1 gene transfer suppresses the progression of micronodular cirrhosis in rats. World J Gastroenterol 2006; 12(13): 2016-2023
- URL: https://www.wjgnet.com/1007-9327/full/v12/i13/2016.htm
- DOI: https://dx.doi.org/10.3748/wjg.v12.i13.2016


