Copyright
©2006 Baishideng Publishing Group Co.
World J Gastroenterol. Mar 14, 2006; 12(10): 1536-1544
Published online Mar 14, 2006. doi: 10.3748/wjg.v12.i10.1536
Published online Mar 14, 2006. doi: 10.3748/wjg.v12.i10.1536
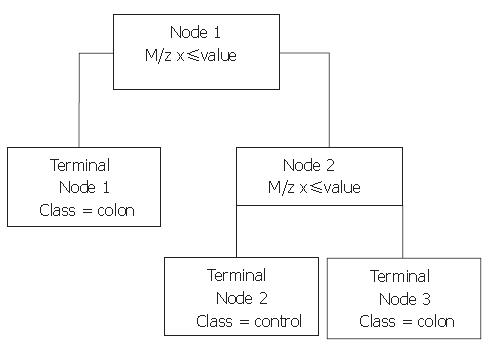
Figure 1 Example of a BPS-generated classification tree distinguishing colorectal cancer patients and healthy controls.
If the peak intensity of an analyzed sample is below the cut-off value at the m/z in the node, the sample proceeds to the left. If not, it proceeds to the right, where its peak intensity at the next m/z is evaluated.
- Citation: Engwegen JY, Helgason HH, Cats A, Harris N, Bonfrer JM, Schellens JH, Beijnen JH. Identification of serum proteins discriminating colorectal cancer patients and healthy controls using surface-enhanced laser desorption ionisation-time of flight mass spectrometry. World J Gastroenterol 2006; 12(10): 1536-1544
- URL: https://www.wjgnet.com/1007-9327/full/v12/i10/1536.htm
- DOI: https://dx.doi.org/10.3748/wjg.v12.i10.1536


