Copyright
©2005 Baishideng Publishing Group Inc.
World J Gastroenterol. Feb 28, 2005; 11(8): 1122-1130
Published online Feb 28, 2005. doi: 10.3748/wjg.v11.i8.1122
Published online Feb 28, 2005. doi: 10.3748/wjg.v11.i8.1122
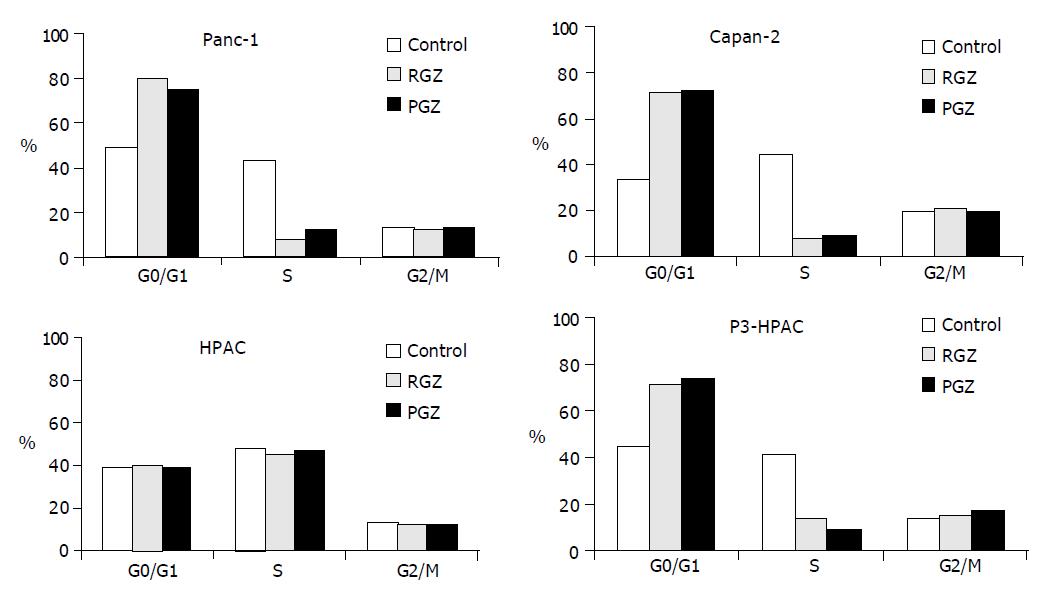
Figure 3 Cell cycle phase distribution of pancreatic tumor cells treated with TZD.
After overnight attachment cells were treated with 20 μmol/L of TZD (RGZ or PGZ) for 72 h, followed by staining with propidium iodide and flow cytometric analysis of DNA content. The percentage of cells in each cell cycle phase was determined by analysis of the DNA content histograms using Modfit software as described in Methods. Data show the percentage of cells in each phase of cell cycle in a representative experiment. Similar results were obtained in at least three independent experiments.
- Citation: Ceni E, Mello T, Tarocchi M, Crabb DW, Caldini A, Invernizzi P, Surrenti C, Milani S, Galli A. Antidiabetic thiazolidinediones induce ductal differentiation but not apoptosis in pancreatic cancer cells. World J Gastroenterol 2005; 11(8): 1122-1130
- URL: https://www.wjgnet.com/1007-9327/full/v11/i8/1122.htm
- DOI: https://dx.doi.org/10.3748/wjg.v11.i8.1122


