Copyright
©2005 Baishideng Publishing Group Inc.
World J Gastroenterol. Feb 14, 2005; 11(6): 810-816
Published online Feb 14, 2005. doi: 10.3748/wjg.v11.i6.810
Published online Feb 14, 2005. doi: 10.3748/wjg.v11.i6.810
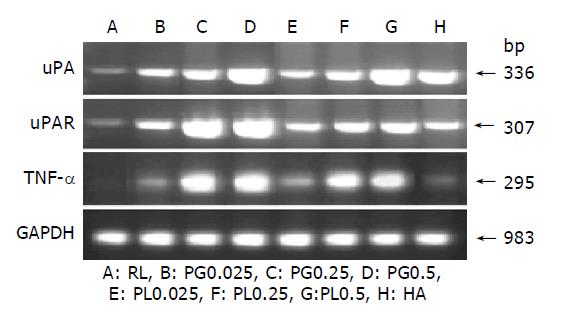
Figure 5 TNF-α, uPA and uPAR mRNA expression in each group (n = 6 per each group).
The TNF-α mRNA was highly expressed, as compared to treatment with RL in PG0.25, 0.5, PL0.25, and 0.5 groups. The uPA gene expression was greatly upregulated by increasing concentration of polysaccharides in the PG and PL treatment groups. The uPAR mRNA was expressed at the highest levels by the treatment with PG0.25 and 0.5. The GAPDH transcript levels among all groups were the same.
-
Citation: Bae JS, Jang KH, Jin HK. Comparison of intraperitoneal anti-adhesive polysaccharides derived from
Phellinus mushrooms in a rat peritonitis model. World J Gastroenterol 2005; 11(6): 810-816 - URL: https://www.wjgnet.com/1007-9327/full/v11/i6/810.htm
- DOI: https://dx.doi.org/10.3748/wjg.v11.i6.810


