Copyright
©2005 Baishideng Publishing Group Inc.
World J Gastroenterol. Dec 21, 2005; 11(47): 7418-7429
Published online Dec 21, 2005. doi: 10.3748/wjg.v11.i47.7418
Published online Dec 21, 2005. doi: 10.3748/wjg.v11.i47.7418
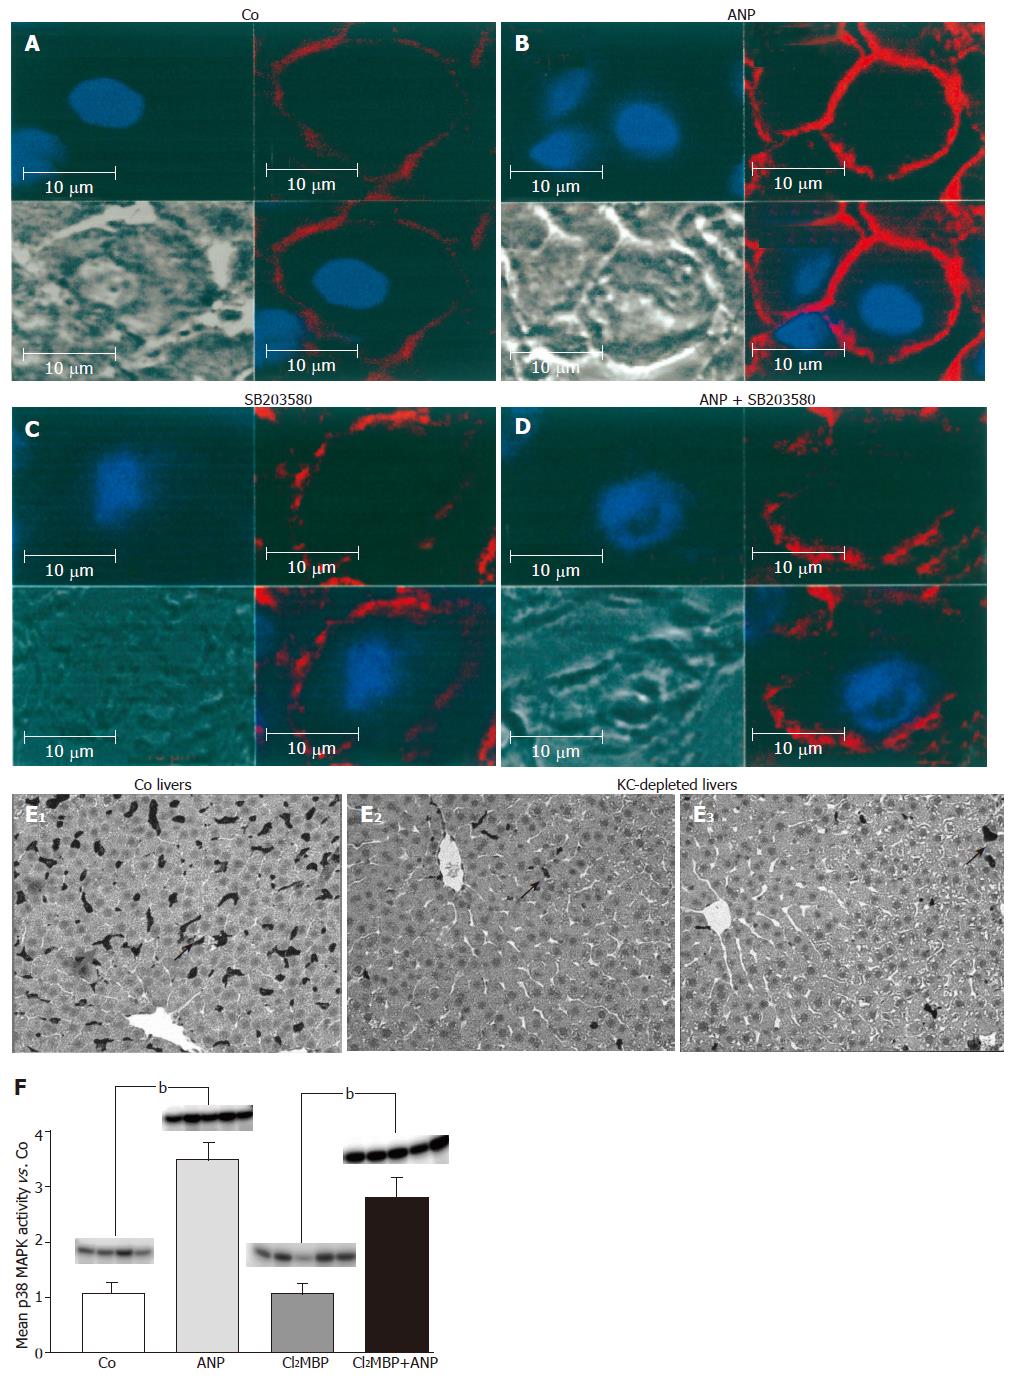
Figure 4 Analysis of the influence of ANP preconditioning on localization of F-actin in the liver by confocal microscopy.
Livers were left untreated (A): preconditioned with 200 nmol/L ANP (B): 2 μmol/L SB203580 (C): or perfused with a combination of ANP (200 nmol/L) and SB203580 (2 μmol/L) (D): After ischemia (24 h, 4 °C), livers were snap-frozen, cut into 6-μm slices and stained with rhodamine-conjugated phalloidin (red, F-actin) and Hoechst 33342 (blue, nuclei) as described in “Materials and methods”. Liver sections were observed by confocal laser microscopy (63-fold amplification). Immunohistological staining of KCs in untreated (Co) and KC-depleted livers (E): rats received an intravenous injection of 900 µL NaCl (Co) or 900 µL liposomes (12 mmol/L Cl2MBP) into the tail vein. After 48 h rat livers were perfused, snap-frozen and liver slices were stained with an antibody against the KC-specific surface marker ED2 (see “Methods”) to verify the Cl2MBP-dependent depletion of the KCs. Dark staining represents KC (hallmarked with arrows). (F): KCs were depleted with Cl2MBP as described under “Methods”. After 48 h control organs (Co) or KC-depleted livers (12 mmol/L Cl2MBP) were perfused±ANP (200 nmol/L) for 20 min. Then p38 MAPK activity was investigated by in vitro phosphorylation assay (see “Methods”). Determination of density light units was performed by phosphorimaging and values of ANP-pretreated cells were divided by mean values of the respective control group. Columns show mean±SE of 4-5 independent perfusion experiments with bP<0.01 being statistically different from the respective control group.
- Citation: Keller M, Gerbes AL, Kulhanek-Heinze S, Gerwig T, Grützner U, Rooijen NV, Vollmar AM, Kiemer AK. Hepatocyte cytoskeleton during ischemia and reperfusion - influence of ANP-mediated p38 MAPK activation. World J Gastroenterol 2005; 11(47): 7418-7429
- URL: https://www.wjgnet.com/1007-9327/full/v11/i47/7418.htm
- DOI: https://dx.doi.org/10.3748/wjg.v11.i47.7418


