Copyright
©2005 Baishideng Publishing Group Inc.
World J Gastroenterol. Nov 28, 2005; 11(44): 6995-7000
Published online Nov 28, 2005. doi: 10.3748/wjg.v11.i44.6995
Published online Nov 28, 2005. doi: 10.3748/wjg.v11.i44.6995
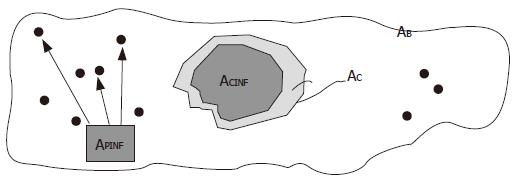
Figure 3 Geometrical structure of clustered inflammatory cells.
AB=true area of the biopsy sample; AC=area of the triangulation-defined cluster (necrosis attraction zone); ACINF=sum of the areas of cluster-resident inflammatory cells; APINF=dispersed non-clustered cells.
- Citation: Dioguardi N, Franceschini B, Russo C, Grizzi F. Computer-aided morphometry of liver inflammation in needle biopsies. World J Gastroenterol 2005; 11(44): 6995-7000
- URL: https://www.wjgnet.com/1007-9327/full/v11/i44/6995.htm
- DOI: https://dx.doi.org/10.3748/wjg.v11.i44.6995


