Copyright
©2005 Baishideng Publishing Group Inc.
World J Gastroenterol. Nov 28, 2005; 11(44): 6926-6931
Published online Nov 28, 2005. doi: 10.3748/wjg.v11.i44.6926
Published online Nov 28, 2005. doi: 10.3748/wjg.v11.i44.6926
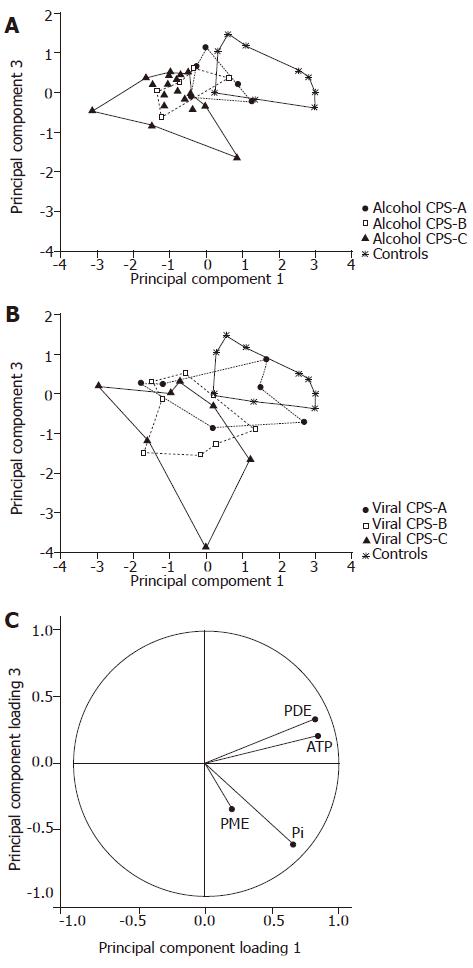
Figure 3 Results of principal component analysis (CPS).
Individual positions of spectra displayed on the PCA scatterplots. Principal components are standardized (centered and scaled to unit variance). Principal component 1 explains 47 % of total variance, principal component explains 3 16% of total variance. (A) Patients with only alcoholic etiology and controls; (B) patients with only viral etiology and controls. Child-Pugh score subgroups (A, B, and C) and controls are bounded. (C) Projection of the principal component loadings on the planes 1 and 3.
- Citation: Dezortova M, Taimr P, Skoch A, Spicak J, Hajek M. Etiology and functional status of liver cirrhosis by 31P MR spectroscopy. World J Gastroenterol 2005; 11(44): 6926-6931
- URL: https://www.wjgnet.com/1007-9327/full/v11/i44/6926.htm
- DOI: https://dx.doi.org/10.3748/wjg.v11.i44.6926


