Copyright
©2005 Baishideng Publishing Group Inc.
World J Gastroenterol. Oct 28, 2005; 11(40): 6385-6388
Published online Oct 28, 2005. doi: 10.3748/wjg.v11.i40.6385
Published online Oct 28, 2005. doi: 10.3748/wjg.v11.i40.6385
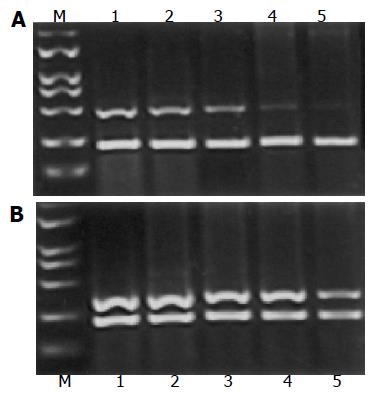
Figure 3 A: Expression of MMP-2 mRNA in SL-174T cells treated with different concentrations of L-NAME.
M: Marker; lane 1: control; lanes 2-5: SL-174T cells treated with 0.2, 0.4, 0.8, and 1.0 mmol/L of L-NAME, respectively. The experiments were carried out in triplicate. Data are expressed as mean±SD; B: Expression of TIMP-2 mRNA in SL-174T cells treated with different concentrations of L-NAME. M: Marker; lane 1: control; lanes 2-5: SL-174T cells treated with 0.2, 0.4, 0.8, and 1.0 mmol/L of L-NAME, respectively. The experiments were carried out in triplicate. Data are expressed as mean±SD.
- Citation: Yu LB, Dong XS, Sun WZ, Zhao DL, Yang Y. Effect of a nitric oxide synthase inhibitor NG-nitro-L-arginine methyl ester on invasion of human colorectal cancer cell line SL-174T. World J Gastroenterol 2005; 11(40): 6385-6388
- URL: https://www.wjgnet.com/1007-9327/full/v11/i40/6385.htm
- DOI: https://dx.doi.org/10.3748/wjg.v11.i40.6385


