Copyright
©The Author(s) 2005.
World J Gastroenterol. Oct 21, 2005; 11(39): 6134-6143
Published online Oct 21, 2005. doi: 10.3748/wjg.v11.i39.6134
Published online Oct 21, 2005. doi: 10.3748/wjg.v11.i39.6134
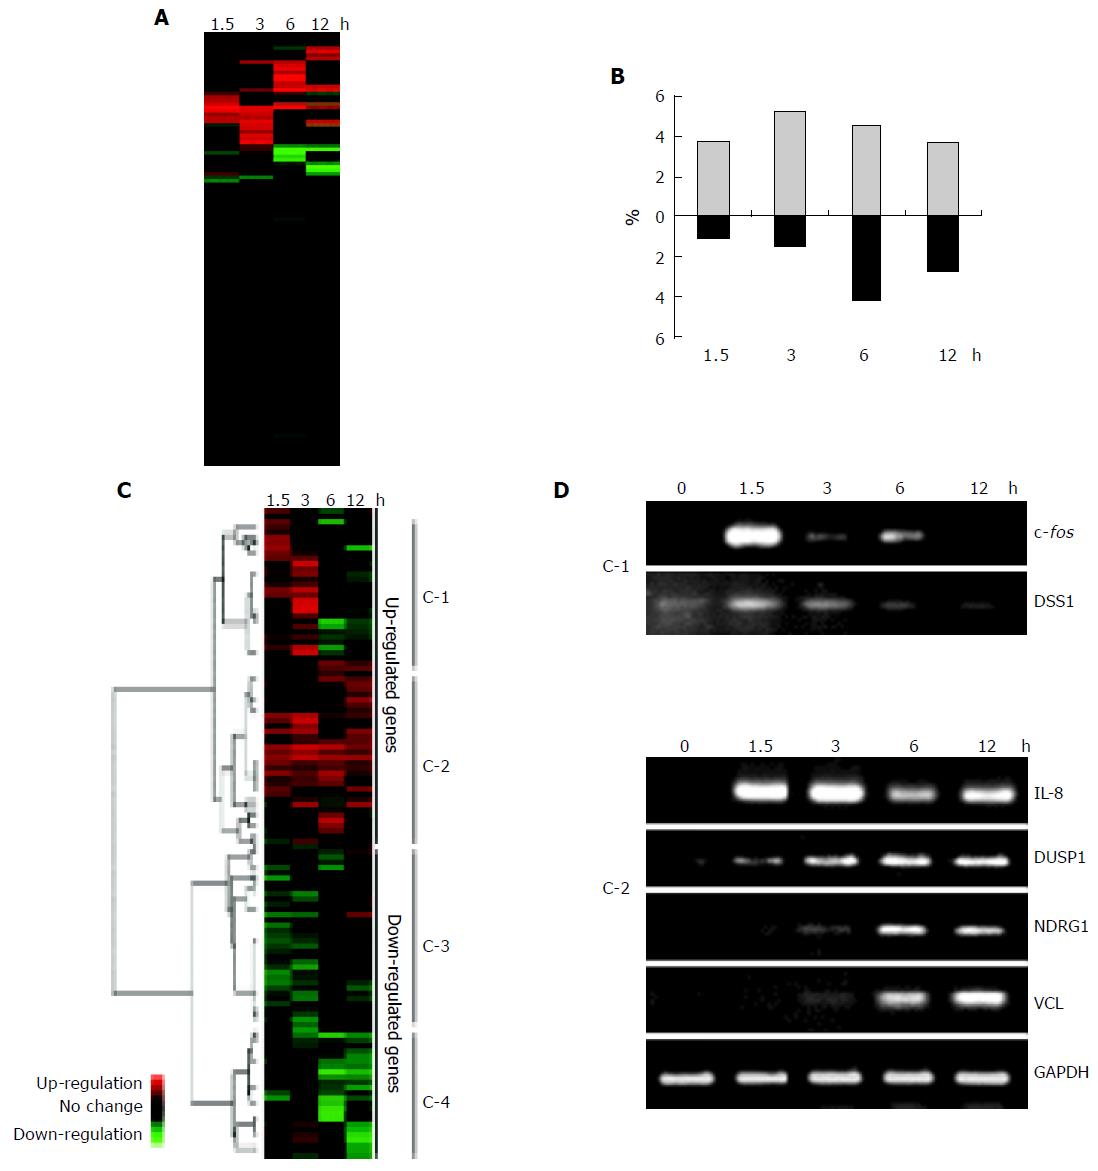
Figure 1 A: Schematic representation of the genes affected by wild-type H pylori-infection during 12 h in AGS cells.
Red or green indicates up- or downregulation, respectively. About 20% of all the analyzed genes were significantly altered during infection experiments in vitro. Changes in expression with a factor of 3 or greater in either direction were considered significant; B: The percentage of the altered genes at each time point. The upregulated genes reached maximum number at 3 h after wild-type H pylori-infection, but the downregulated genes peaked at 6 h after infection; C: Cluster diagram of gene expression in AGS cells. The rows correspond to 3 228 genes for which the level of expression in AGS was changed by infection with wild-type H pylori, and the columns represent the various time points (1.5, 3, 6, and 12 h after wild-type H pylori-infection from left to right, respectively). Red or green indicates up- or downregulation, respectively, compared with the expression level in uninfected AGS cells. The dendrogram on the left and the horizontal distances between the nodes represent the statistical similarities between the neighboring genes and clusters. The genes were divided into two large clusters, comprising upregulated or downregulated genes. Each of the large clusters contained two smaller clusters, resulting in four clusters (C-1 to C-4; see Results for description); D: Validation of the microarray results by RT-PCR. Total RNAs from wild-type H pylori-infected AGS cells were isolated at the indicated times and subjected to reverse transcription and PCR with specific primers. The bands of the size corresponding to the expected length of the amplified fragment for each specific transcript were analyzed by agarose gel electrophoresis, along with GAPDH as a loading control.
-
Citation: Shibata W, Hirata Y, Yoshida H, Otsuka M, Hoshida Y, Ogura K, Maeda S, Ohmae T, Yanai A, Mitsuno Y, Seki N, Kawabe T, Omata M. NF-kB and ERK-signaling pathways contribute to the gene expression induced by
cag PAI-positive-Helicobacter pylori infection. World J Gastroenterol 2005; 11(39): 6134-6143 - URL: https://www.wjgnet.com/1007-9327/full/v11/i39/6134.htm
- DOI: https://dx.doi.org/10.3748/wjg.v11.i39.6134


