Copyright
©The Author(s) 2005.
World J Gastroenterol. Oct 14, 2005; 11(38): 5958-5965
Published online Oct 14, 2005. doi: 10.3748/wjg.v11.i38.5958
Published online Oct 14, 2005. doi: 10.3748/wjg.v11.i38.5958
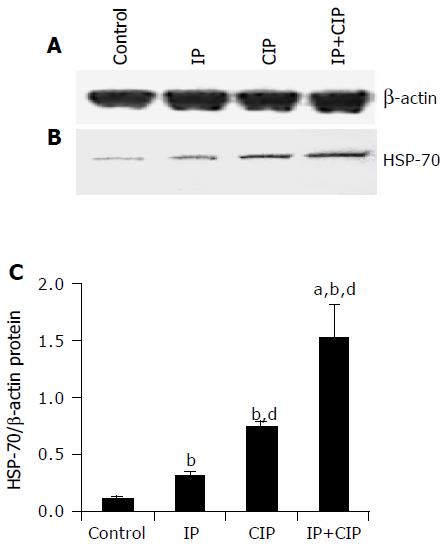
Figure 2 Representative Western blot analysis of b-actin protein (A) and HSP 70 (B), and the ratio of HSP 70 over b-actin protein (C) in pancreatic tissue of sham-operated control rats (lane 1), rats exposed to IP (lane 2), sham-operated rats with cerulein-induced pancreatitis (CIP, lane 3), and rats with IP applied prior to cerulein-induced pancreatitis (IP+CIP, lane 4).
bP<0.001 vs sham-operated rats treated with cerulein alone (CIP), aP<0.05 vs sham-operated saline-treated control, dP<0.001 vs rats exposed to IP without induction of acute pancreatitis (CIP).
- Citation: Warzecha Z, Dembinski A, Ceranowicz P, Konturek SJ, Dembinski M, Pawlik WW, Tomaszewska R, Stachura J, Kusnierz-Cabala B, Naskalski JW, Konturek PC. Ischemic preconditioning inhibits development of edematous cerulein-induced pancreatitis: Involvement of cyclooxygenases and heat shock protein 70. World J Gastroenterol 2005; 11(38): 5958-5965
- URL: https://www.wjgnet.com/1007-9327/full/v11/i38/5958.htm
- DOI: https://dx.doi.org/10.3748/wjg.v11.i38.5958


