Copyright
©The Author(s) 2005.
World J Gastroenterol. Oct 7, 2005; 11(37): 5845-5852
Published online Oct 7, 2005. doi: 10.3748/wjg.v11.i37.5845
Published online Oct 7, 2005. doi: 10.3748/wjg.v11.i37.5845
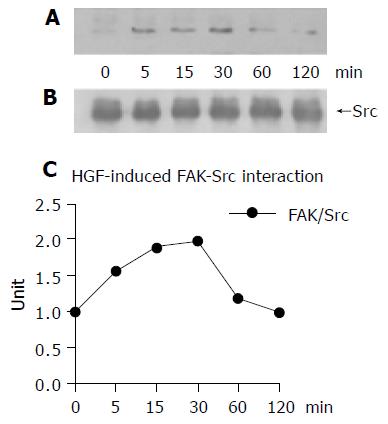
Figure 6 The interaction between Src and FAK was demonstrated in HGF-treated HuCCA-1 cells by co-immunoprecipitation at varied time points.
The resulting bands showed a positive correlation of FAK with Src phosphorylation, which reached a maximum at 30 min and then declined (A). The amount of Src protein (upper bands) used in each time point was confirmed (B). The density of bands was measured and the ratio between FAK and Src was plotted in the graph (C).
- Citation: Pongchairerk U, Guan JL, Leardkamolkarn V. Focal adhesion kinase and Src phosphorylations in HGF-induced proliferation and invasion of human cholangiocarcinoma cell line, HuCCA-1. World J Gastroenterol 2005; 11(37): 5845-5852
- URL: https://www.wjgnet.com/1007-9327/full/v11/i37/5845.htm
- DOI: https://dx.doi.org/10.3748/wjg.v11.i37.5845


