Copyright
©2005 Baishideng Publishing Group Inc.
World J Gastroenterol. Sep 21, 2005; 11(35): 5512-5516
Published online Sep 21, 2005. doi: 10.3748/wjg.v11.i35.5512
Published online Sep 21, 2005. doi: 10.3748/wjg.v11.i35.5512
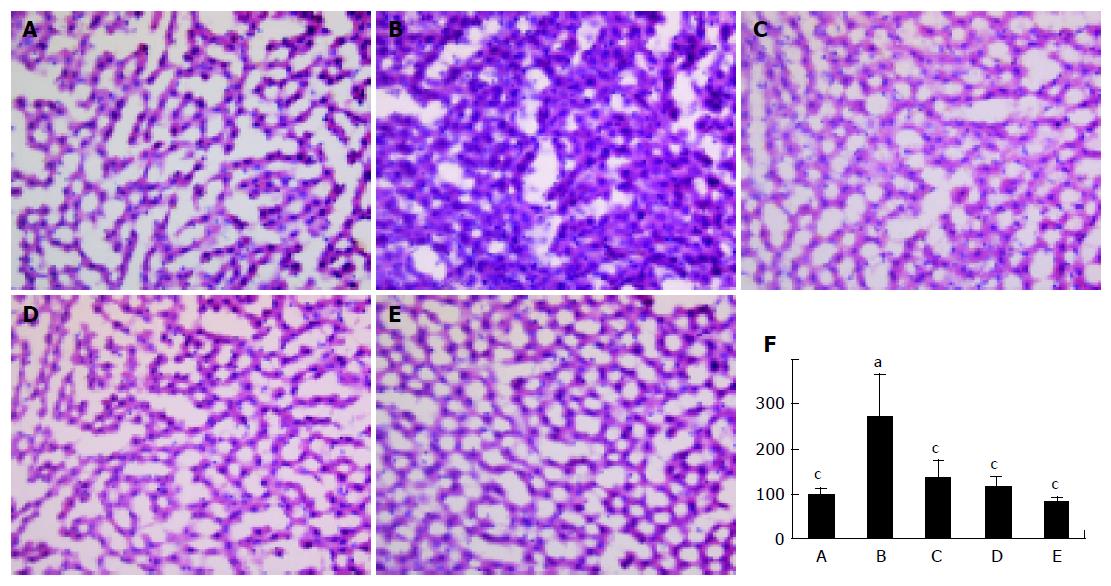
Figure 3 Liver histology in rats treated with alcohol or alcohol plus TCM.
Frozen sections of liver (×40) taken from (A) CD+saline, (B) ED+saline, (C) ED+TCM2000, (D) ED+TCM667, (E) ED+TCM222-treated rats on 10 wk, (F) densitometer analysis: the representative experiment A–E were quantified and the integrated area were percentized in control rats (100%). In A-E, frozen sections were stained with Oil Red O and counterstained with Mayer’s hematoxylin. Lipid droplets were stained red. aP<0.05, cP<0.05 vs others.
- Citation: Kwon HJ, Kim YY, Choung SY. Amelioration effects of traditional Chinese medicine on alcohol-induced fatty liver. World J Gastroenterol 2005; 11(35): 5512-5516
- URL: https://www.wjgnet.com/1007-9327/full/v11/i35/5512.htm
- DOI: https://dx.doi.org/10.3748/wjg.v11.i35.5512


