Copyright
©The Author(s) 2005.
World J Gastroenterol. Sep 14, 2005; 11(34): 5351-5357
Published online Sep 14, 2005. doi: 10.3748/wjg.v11.i34.5351
Published online Sep 14, 2005. doi: 10.3748/wjg.v11.i34.5351
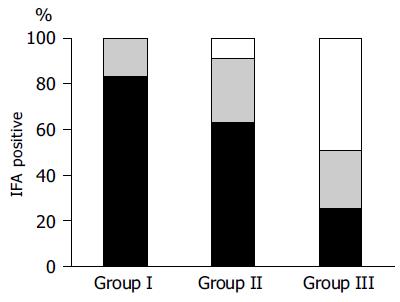
Figure 3 Distribution of clinical presentations of ABG with respect to positivity of IFA and H pylori status.
H pylori negative at histology and serology (n = 33), H pylori negative at histology and positive at serology (n = 76), H pylori positive at histology and serology (n = 31). Diagonal lines = pernicious anemia; vertical lines = iron deficiency anemia; horizontal lines = dyspepsia.
- Citation: Annibale B, Lahner E, Negrini R, Baccini F, Bordi C, Monarca B, Fave GD. Lack of specific association between gastric autoimmunity hallmarks and clinical presentations of atrophic body gastritis. World J Gastroenterol 2005; 11(34): 5351-5357
- URL: https://www.wjgnet.com/1007-9327/full/v11/i34/5351.htm
- DOI: https://dx.doi.org/10.3748/wjg.v11.i34.5351


