Copyright
©The Author(s) 2005.
World J Gastroenterol. Sep 14, 2005; 11(34): 5266-5272
Published online Sep 14, 2005. doi: 10.3748/wjg.v11.i34.5266
Published online Sep 14, 2005. doi: 10.3748/wjg.v11.i34.5266
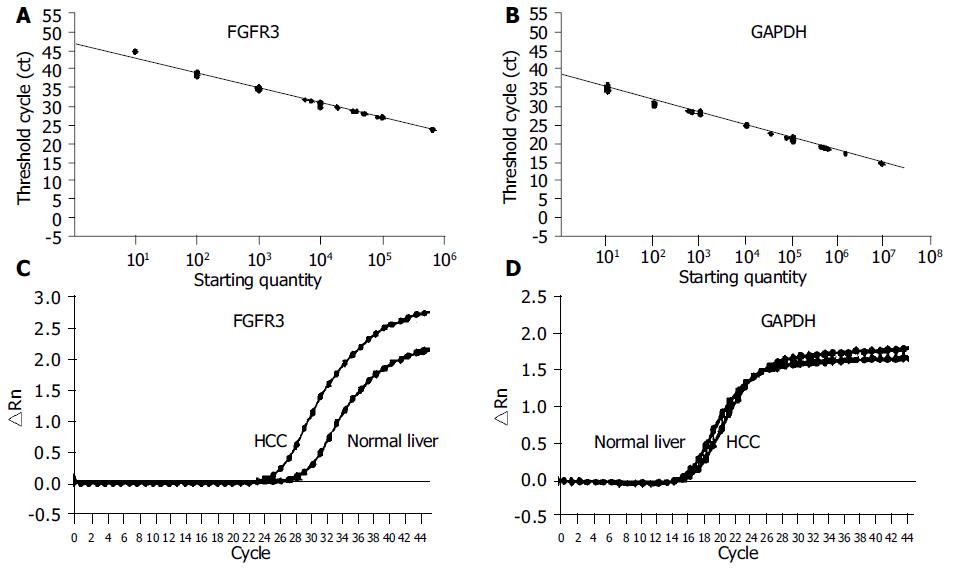
Figure 2 Standard curve and amplification plots of FGFR3 and GAPDH by quantitative real-time PCR.
Starting quantity FGFR3 (A) and GAPDH (B); cycle FGFR3 (C) and GAPDH (D).
- Citation: Qiu WH, Zhou BS, Chu PG, Chen WG, Chung C, Shih J, Hwu P, Yeh C, Lopez R, Yen Y. Over-expression of fibroblast growth factor receptor 3 in human hepatocellular carcinoma. World J Gastroenterol 2005; 11(34): 5266-5272
- URL: https://www.wjgnet.com/1007-9327/full/v11/i34/5266.htm
- DOI: https://dx.doi.org/10.3748/wjg.v11.i34.5266


