Copyright
©The Author(s) 2005.
World J Gastroenterol. Sep 7, 2005; 11(33): 5151-5155
Published online Sep 7, 2005. doi: 10.3748/wjg.v11.i33.5151
Published online Sep 7, 2005. doi: 10.3748/wjg.v11.i33.5151
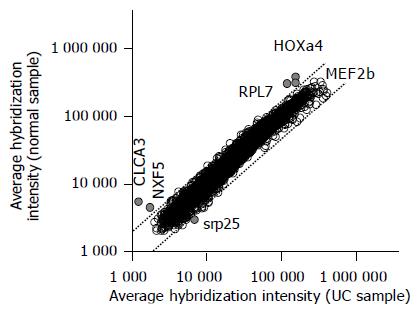
Figure 1 Comparison of expression of genes in non-inflamed mucosa of ulcerative colitis (UC) and normal control mucosa.
The upper and lower boundaries represent a 2- and 0.5-fold difference in the mean of the expression of each gene between noninflamed UC mucosa and control, respectively. Axis scales are logarithmic.
- Citation: Toiyama Y, Mizoguchi A, Kimura K, Araki T, Yoshiyama S, Sakaguchi K, Miki C, Kusunoki M. Persistence of gene expression changes in noninflamed and inflamed colonic mucosa in ulcerative colitis and their presence in colonic carcinoma. World J Gastroenterol 2005; 11(33): 5151-5155
- URL: https://www.wjgnet.com/1007-9327/full/v11/i33/5151.htm
- DOI: https://dx.doi.org/10.3748/wjg.v11.i33.5151


