Copyright
©The Author(s) 2005.
World J Gastroenterol. Aug 21, 2005; 11(31): 4807-4811
Published online Aug 21, 2005. doi: 10.3748/wjg.v11.i31.4807
Published online Aug 21, 2005. doi: 10.3748/wjg.v11.i31.4807
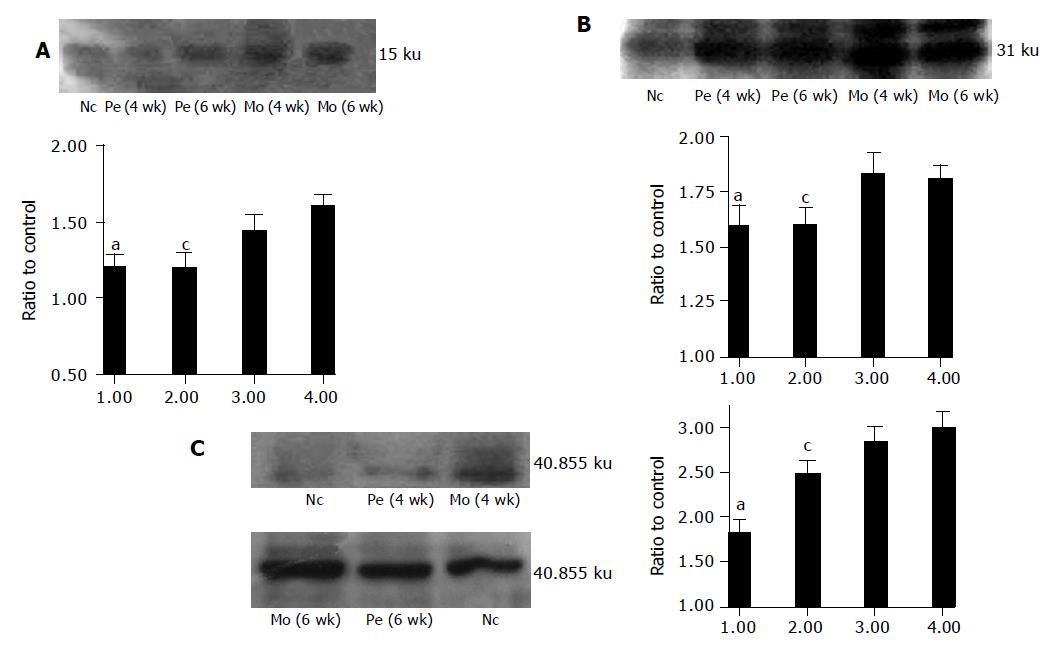
Figure 2 Western blot analysis A: Western blot analysis of TGF-b1 protein expression.
Effect of perindopril on TGF-b1 expression in CCl4-induced hepatic fibrosis of rat. Cell lysates were obtained as described in Methods. Protein (50 mg/lane) were separated by 15% SDS-PAGE under denaturing conditions, transferred to PVDF membranes and then incubated with specific antibody (1:700). Ratio to control presents TGF-b1 protein level. 1: Pe (4 wk); 2: Pe (6 wk); 3: Mo (4 wk); 4: Mo (6 wk) Results are the mean±SD from three independent experiments. aP<0.05 vs Mo (4 wk); cP<0.05 vs Mo (6 wk); B: Western blot analysis of PDGF-BB protein expression. Effect of perindopril on PDGF-BB expression in CCl4-induced hepatic fibrosis of rat. Cell lysates were obtained as described in Methods. Protein (50 mg/lane) were separated by 10% SDS-PAGE under denaturing conditions, transferred to PVDF membranes and then incubated with specific antibody (1:700). Ratio to control presents PDGF-BB protein level. 1: Pe (4 wk); 2: Pe (6 wk); 3: Mo (4 wk);4: Mo (6 wk) Results are the mean±SD from three independent experiments. aP<0.05 vs Mo (4 wk); cP<0.05 vs Mo (6 wk); C: Western blot analysis of AT1R protein expression. Effect of perindopril on AT1R expression in CCl4-induced hepatic fibrosis of rat. Cell lysates were obtained as described in Methods. Protein (50 mg/lane) were separated by 10% SDS-PAGE under denaturing conditions, transferred to PVDF membranes and then incubated with specific antibody (1:700). Ratio to control presents AT1R protein level. 1: Pe (4 wk); 2: Pe (6 wk); 3: Mo (4 wk); 4: Mo (6 wk) Results are the mean±SD from three independent experiments. aP<0.05 vs Mo (4 wk); cP<0.05 vs Mo (6 wk).
- Citation: Li X, Meng Y, Yang XS, Mi LF, Cai SX. ACEI attenuates the progression of CCl4-induced rat hepatic fibrogenesis by inhibiting TGF-β1, PDGF-BB, NF-κB and MMP-2,9. World J Gastroenterol 2005; 11(31): 4807-4811
- URL: https://www.wjgnet.com/1007-9327/full/v11/i31/4807.htm
- DOI: https://dx.doi.org/10.3748/wjg.v11.i31.4807


