Copyright
©The Author(s) 2005.
World J Gastroenterol. Jul 28, 2005; 11(28): 4382-4389
Published online Jul 28, 2005. doi: 10.3748/wjg.v11.i28.4382
Published online Jul 28, 2005. doi: 10.3748/wjg.v11.i28.4382
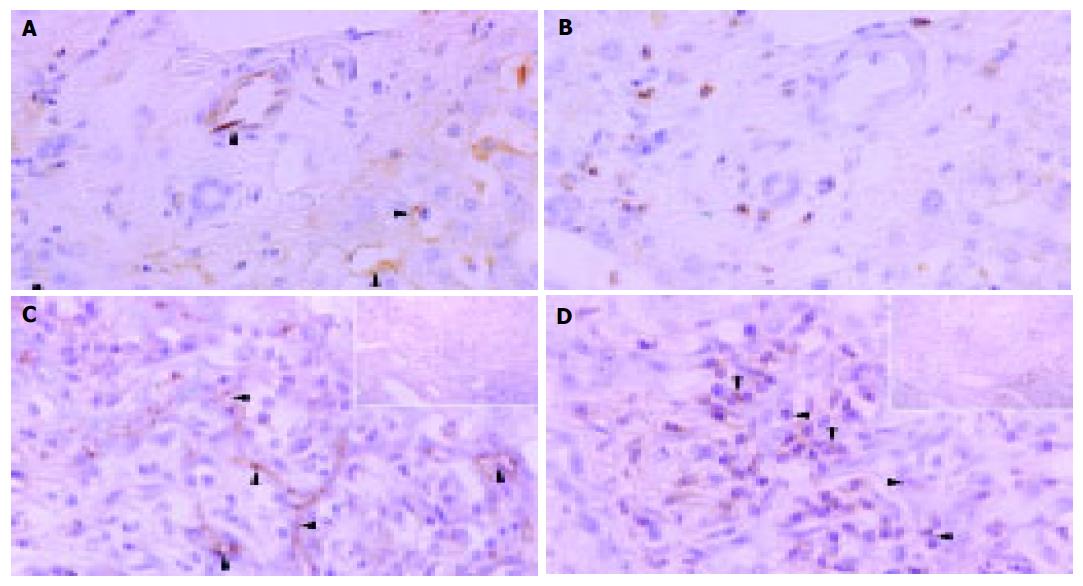
Figure 2 Immunohistochemical distributions of ICAM-1 ( A and C) and LFA-1 ( B and D) in control liver tissue ( A and D) and liver tissue of PHC ( C and D).
A: ICAM-1 protein expression on sinusoidal lining cells but no specific immunoreactivity on bile duct epithelial cells in control liver specimens; B: LFA-1 immunoreactivity in portal lymphoid cells, negative in interlobular bile ducts and sparse expression in bile duct epithelial cells; C: Marked ICAM-1 immunoreactivity on the plasma membrane on the luminal side of bile ductules or possibly small blood vessels. Some lymphocytes around the bile ducts were also positive for ICAM-1. Arrowheads denote localization of ICAM-1 (arrows); D: LFA-1 immunoreactivity in lymphocytes around and among damaged bile ducts (arrowheads). Original magnification; ×400, hematoxylin counterstained.
- Citation: Yokomori H, Oda M, Ogi M, Wakabayashi G, Kawachi S, Yoshimura K, Nagai T, Kitajima M, Nomura M, Hibi T. Expression of adhesion molecules on mature cholangiocytes in canal of Hering and bile ductules in wedge biopsy samples of primary biliary cirrhosis. World J Gastroenterol 2005; 11(28): 4382-4389
- URL: https://www.wjgnet.com/1007-9327/full/v11/i28/4382.htm
- DOI: https://dx.doi.org/10.3748/wjg.v11.i28.4382


