Copyright
©The Author(s) 2005.
World J Gastroenterol. Jul 21, 2005; 11(27): 4167-4172
Published online Jul 21, 2005. doi: 10.3748/wjg.v11.i27.4167
Published online Jul 21, 2005. doi: 10.3748/wjg.v11.i27.4167
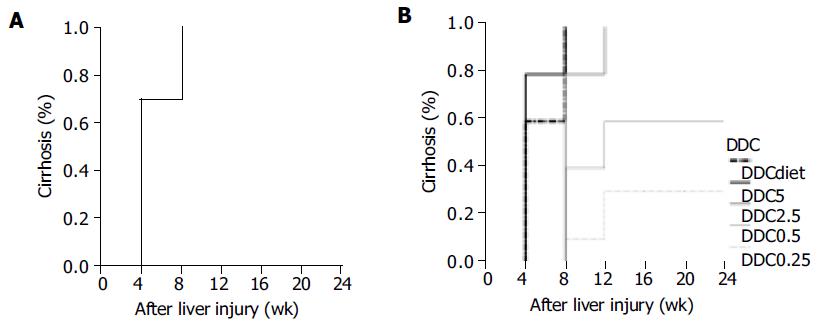
Figure 2 Cirrhosis rates of CBDL and DDC groups.
A: The cirrhosis curve for CBDL group is shown; B: The cirrhosis curves for 5 DDC subgroups are shown. The number immediately behind DDC indicates its dosage used in mg per mouse. DDC diet represents 0.1% DDC contained diet.
- Citation: Chang ML, Yeh CT, Chang PY, Chen JC. Comparison of murine cirrhosis models induced by hepatotoxin administration and common bile duct ligation. World J Gastroenterol 2005; 11(27): 4167-4172
- URL: https://www.wjgnet.com/1007-9327/full/v11/i27/4167.htm
- DOI: https://dx.doi.org/10.3748/wjg.v11.i27.4167


