Copyright
©2005 Baishideng Publishing Group Inc.
World J Gastroenterol. Jun 21, 2005; 11(23): 3508-3513
Published online Jun 21, 2005. doi: 10.3748/wjg.v11.i23.3508
Published online Jun 21, 2005. doi: 10.3748/wjg.v11.i23.3508
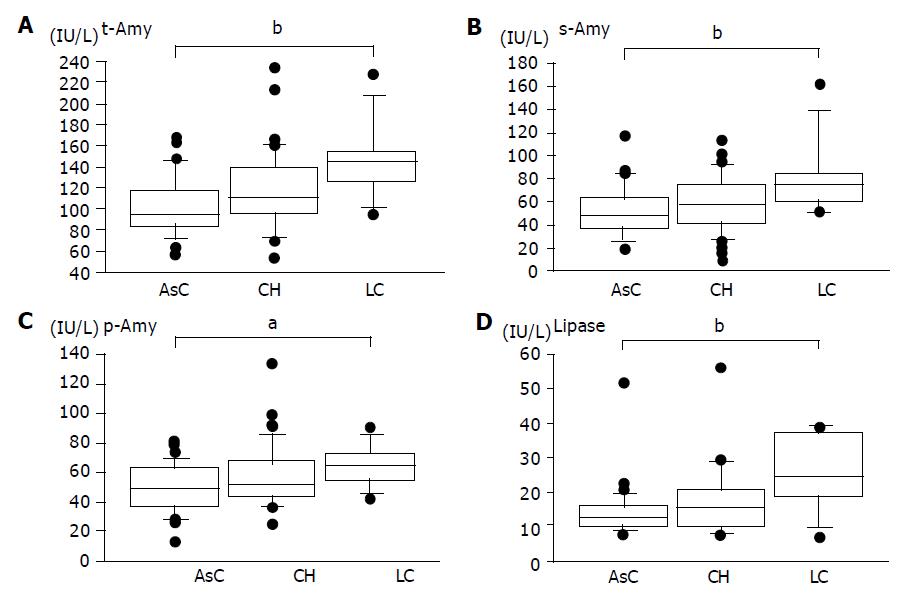
Figure 4 Distribution of serum enzyme levels at several stages of CH B.
Box plots are given with horizontal lines for the medians, upper and lower edges indicating the 25th and 75th percentiles, respectively, and bars represent the extremes without including outliers. _ indicates outliers and ● indicates extremities. P values indicate the correlation between the enzyme levels and the progression of liver disease (A-D). aP<0.05, bP<0.01 vs others.
- Citation: Katakura Y, Yotsuyanagi H, Hashizume K, Okuse C, Okuse N, Nishikawa K, Suzuki M, Iino S, Itoh F. Pancreatic involvement in chronic viral hepatitis. World J Gastroenterol 2005; 11(23): 3508-3513
- URL: https://www.wjgnet.com/1007-9327/full/v11/i23/3508.htm
- DOI: https://dx.doi.org/10.3748/wjg.v11.i23.3508


