Copyright
©2005 Baishideng Publishing Group Inc.
World J Gastroenterol. Jun 14, 2005; 11(22): 3405-3410
Published online Jun 14, 2005. doi: 10.3748/wjg.v11.i22.3405
Published online Jun 14, 2005. doi: 10.3748/wjg.v11.i22.3405
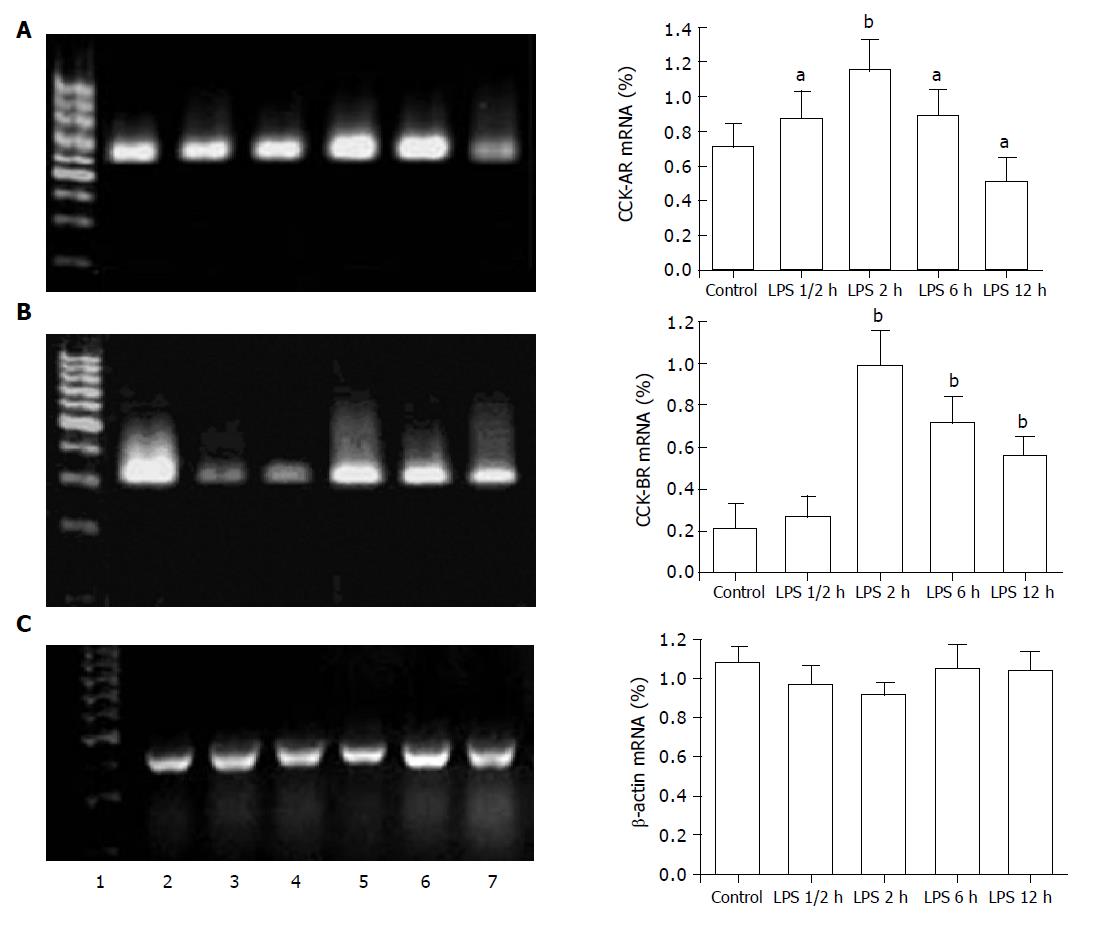
Figure 4 Expression of CCK-A/BR and β-actin mRNA of RT-PCR in the myocardium of ES rats.
(mean±SD, n = 3) aP<0.05 vs control, bP<0.01 vs control. A: Representative pictures of CCK-AR (630 bp); B: representative pictures of CCK-BR (320 bp); C: representative pictures of β-actin (420 bp). Lane 1: DNA marker, lane 2: products expressed from kidney tissue as a positive control, lane 3: products expressed from control-saline-treated, lanes 4-7: products expressed from LPS-treated at 0.5, 2, 6, and 12 h, respectively.
- Citation: Zhao XY, Ling YL, Li YG, Meng AH, Xing HY. Cholecystokinin octapeptide improves cardiac function by activating cholecystokinin octapeptide receptor in endotoxic shock rats. World J Gastroenterol 2005; 11(22): 3405-3410
- URL: https://www.wjgnet.com/1007-9327/full/v11/i22/3405.htm
- DOI: https://dx.doi.org/10.3748/wjg.v11.i22.3405


