Copyright
©2005 Baishideng Publishing Group Inc.
World J Gastroenterol. Jun 14, 2005; 11(22): 3346-3350
Published online Jun 14, 2005. doi: 10.3748/wjg.v11.i22.3346
Published online Jun 14, 2005. doi: 10.3748/wjg.v11.i22.3346
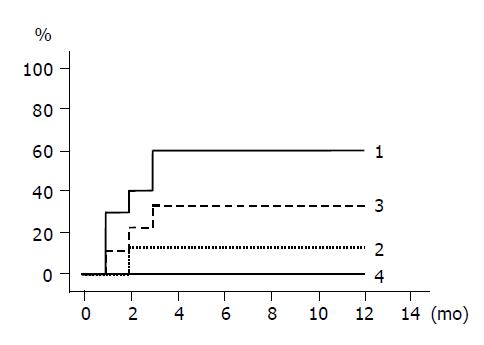
Figure 4 Cumulative incidence of HBeAg seroconversion of groups 1 to 4 by Kaplan-Meier method.
Group 1 is indicated by thick line, group 2 by dotted line, group 3 by dashed line, and group 4 by thin line. Groups 1 vs 2, P = 0.048; groups 1 vs 3, P = NS; groups 2 vs 3, P = NS (log-rank test).
- Citation: Kurihara T, Imazeki F, Yokosuka O, Fukai K, Kanda T, Kawai S, Saisho H. Effect of lamivudine in HBeAg-positive chronic hepatitis B: Discordant effect on HBeAg and HBV DNA according to pretreatment ALT level. World J Gastroenterol 2005; 11(22): 3346-3350
- URL: https://www.wjgnet.com/1007-9327/full/v11/i22/3346.htm
- DOI: https://dx.doi.org/10.3748/wjg.v11.i22.3346


