Copyright
©2005 Baishideng Publishing Group Inc.
World J Gastroenterol. May 21, 2005; 11(19): 2906-2911
Published online May 21, 2005. doi: 10.3748/wjg.v11.i19.2906
Published online May 21, 2005. doi: 10.3748/wjg.v11.i19.2906
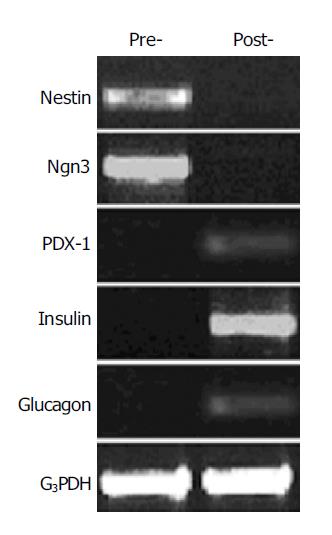
Figure 4 RT-PCR analysis of gene expression change in the nestin-positive cells before and after induction by using the primers for nestin (549 bp), Ngn3 (420 bp), PDX-1 (262 bp), insulin (261 bp), and glucagon (236 bp).
G3PDH were used as internal control (452 bp). Pre-, cells before induction; post-, cells after induction.
- Citation: Zhang L, Hong TP, Hu J, Liu YN, Wu YH, Li LS. Nestin-positive progenitor cells isolated from human fetal pancreas have phenotypic markers identical to mesenchymal stem cells. World J Gastroenterol 2005; 11(19): 2906-2911
- URL: https://www.wjgnet.com/1007-9327/full/v11/i19/2906.htm
- DOI: https://dx.doi.org/10.3748/wjg.v11.i19.2906


