Copyright
©2005 Baishideng Publishing Group Inc.
World J Gastroenterol. May 21, 2005; 11(19): 2900-2905
Published online May 21, 2005. doi: 10.3748/wjg.v11.i19.2900
Published online May 21, 2005. doi: 10.3748/wjg.v11.i19.2900
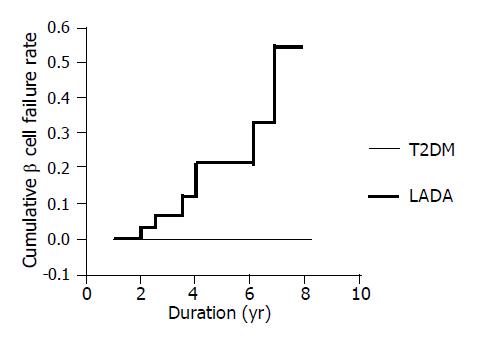
Figure 5 Survival analysis of the cumulative failure rates of islet β cell function in LADA and T2DM patients during the follow-up period.
The X-axis represented the duration of diabetes and Y-axis meant the cumulative proportion of β cell failure in these patients. Patient that developed β cell failure would be supposed as “dead”, otherwise, as “survival” at different period of duration (called “survival time”). The dotted and the solid line represented LADA and T2DM patients respectively. The β cell failure cumulative rate increased from 0.074 at the 2nd year to 0.462 at the 8th year of duration in LADA patients; however, that of T2DM remained unchangeable in the whole period.
- Citation: Yang L, Zhou ZG, Huang G, Ouyang LL, Li X, Yan X. Six-year follow-up of pancreatic β cell function in adults with latent autoimmune diabetes. World J Gastroenterol 2005; 11(19): 2900-2905
- URL: https://www.wjgnet.com/1007-9327/full/v11/i19/2900.htm
- DOI: https://dx.doi.org/10.3748/wjg.v11.i19.2900


