Copyright
©2005 Baishideng Publishing Group Inc.
World J Gastroenterol. May 14, 2005; 11(18): 2739-2743
Published online May 14, 2005. doi: 10.3748/wjg.v11.i18.2739
Published online May 14, 2005. doi: 10.3748/wjg.v11.i18.2739
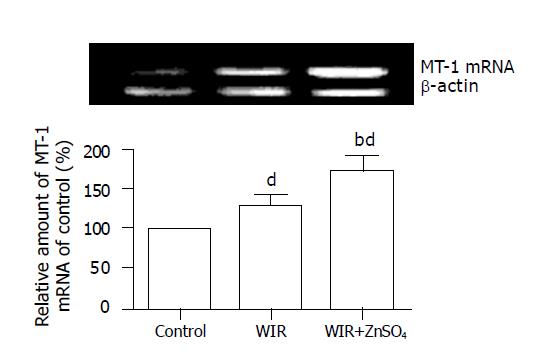
Figure 3 RT-PCR analysis of stomach MT-1 mRNA level.
The data (expressed as ratio of MT-1 mRNA and β-actin mRNA) were shown as mean±SD (n = 3/group) bP<0.01 vs control, dP<0.01 vs WIR group.
- Citation: Jiang P, Chang L, Pan CS, Qi YF, Tang CS. Protective role of metallothionein in stress-induced gastric ulcer in rats. World J Gastroenterol 2005; 11(18): 2739-2743
- URL: https://www.wjgnet.com/1007-9327/full/v11/i18/2739.htm
- DOI: https://dx.doi.org/10.3748/wjg.v11.i18.2739


