Copyright
©2005 Baishideng Publishing Group Inc.
World J Gastroenterol. May 7, 2005; 11(17): 2616-2625
Published online May 7, 2005. doi: 10.3748/wjg.v11.i17.2616
Published online May 7, 2005. doi: 10.3748/wjg.v11.i17.2616
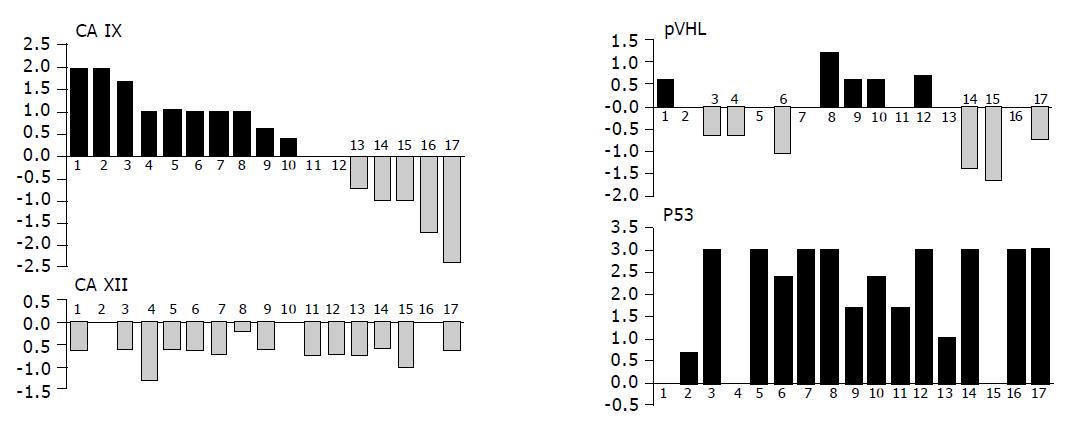
Figure 6 Graphical illustration of the tumor-associated differences in expression of pVHL, CA IX, CA XII and p53 in individual patients analyzed by immunohistochemistry (the same person is designated by the same number in all graphs).
Values of staining indices obtained in normal tissues were subtracted from those obtained in corresponding pathological lesions from the same person (mean value was used when more tumor specimens were available from one patient). Resulting data were shown in histograms on compatible scales demonstrating the range of differences related to each marker and allowing for their visual comparisons. There were no relationships found between the studied proteins.
- Citation: Kivela AJ, Parkkila S, Saarnio J, Karttunen TJ, Kivela J, Parkkila AK, Bartosova M, Mucha V, Novak M, Waheed A, Sly WS, Rajaniemi H, Pastorekova S, Pastorek J. Expression of von Hippel-Lindau tumor suppressor and tumor-associated carbonic anhydrases IX and XII in normal and neoplastic colorectal mucosa. World J Gastroenterol 2005; 11(17): 2616-2625
- URL: https://www.wjgnet.com/1007-9327/full/v11/i17/2616.htm
- DOI: https://dx.doi.org/10.3748/wjg.v11.i17.2616


