Copyright
©2005 Baishideng Publishing Group Inc.
World J Gastroenterol. May 7, 2005; 11(17): 2603-2608
Published online May 7, 2005. doi: 10.3748/wjg.v11.i17.2603
Published online May 7, 2005. doi: 10.3748/wjg.v11.i17.2603
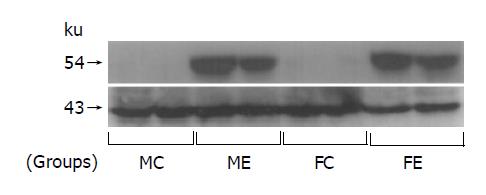
Figure 3 Representative Western blot of hepatic microsomal protein showing the induction of CYP2E1 due to chronic ethanol administration both in male and in female rats.
Each lane represents an individual rat liver. The indicated apparent molecular masses of CYP2E1 and actin (internal control) were 54 and 43 ku, respectively.
- Citation: Huang CC, Chen JR, Liu CC, Chen KT, Shieh MJ, Yang SC. Effects of long-term ethanol consumption on jejunal lipase and disaccharidase activities in male and female rats. World J Gastroenterol 2005; 11(17): 2603-2608
- URL: https://www.wjgnet.com/1007-9327/full/v11/i17/2603.htm
- DOI: https://dx.doi.org/10.3748/wjg.v11.i17.2603


