Copyright
©2005 Baishideng Publishing Group Inc.
World J Gastroenterol. Apr 28, 2005; 11(16): 2508-2512
Published online Apr 28, 2005. doi: 10.3748/wjg.v11.i16.2508
Published online Apr 28, 2005. doi: 10.3748/wjg.v11.i16.2508
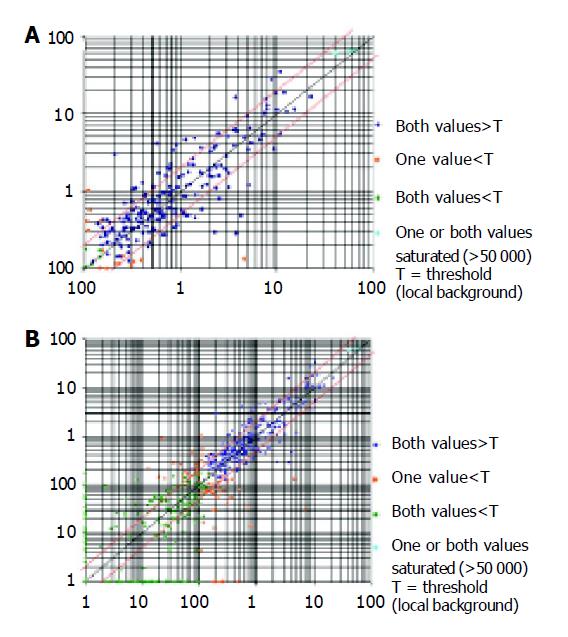
Figure 1 Chip result analysis of EC cells (A) and U937 cell line (B).
The x-axis is the relative intensity of cy3 signal, and y-axis is the relative intensity of cy5 signal. The ratio x/y≥R2 shows that the gene expression was up-regulated, and x/y≤0.5 shows that the gene was down-regulated.
- Citation: Bian GX, Miao H, Qiu L, Cao DM, Guo BY. Profiling of differentially expressed chemotactic-related genes in MCP-1 treated macrophage cell line using human cDNA arrays. World J Gastroenterol 2005; 11(16): 2508-2512
- URL: https://www.wjgnet.com/1007-9327/full/v11/i16/2508.htm
- DOI: https://dx.doi.org/10.3748/wjg.v11.i16.2508


