Copyright
©2005 Baishideng Publishing Group Inc.
World J Gastroenterol. Apr 28, 2005; 11(16): 2497-2501
Published online Apr 28, 2005. doi: 10.3748/wjg.v11.i16.2497
Published online Apr 28, 2005. doi: 10.3748/wjg.v11.i16.2497
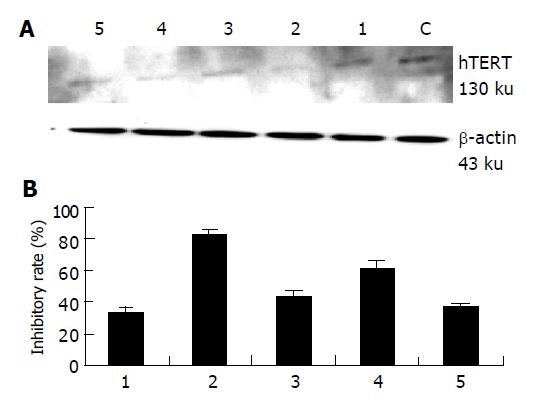
Figure 3 Inhibition of hTERT protein expression in HepG2 cells after 72-h transfection with 100 nmol/L siRNA.
A: Western-blot analysis of hTERT protein expression in HepG2 cells. Lanes 1-5: HepG2 cells treated with 100 nmol/L siRNA1-siRNA5; Lane C: Cells treated with LipofectamineTM2000 only; B: Inhibitory percentage of hTERT protein in siRNA treated cells compared to the cells treated with LipofectamineTM2000 alone. Each level of hTERT protein was quantitated and normalized to the level of β-actin. Inhibitory rates were calculated by comparison to cells treated with LipofectamineTM2000 alone and results were expressed as mean±SD from two independent experiments.
- Citation: Xia Y, Lin RX, Zheng SJ, Yang Y, Bo XC, Zhu DY, Wang SQ. Effective siRNA targets screening for human telomerase reverse transcriptase. World J Gastroenterol 2005; 11(16): 2497-2501
- URL: https://www.wjgnet.com/1007-9327/full/v11/i16/2497.htm
- DOI: https://dx.doi.org/10.3748/wjg.v11.i16.2497


