Copyright
©2005 Baishideng Publishing Group Inc.
World J Gastroenterol. Apr 21, 2005; 11(15): 2306-2312
Published online Apr 21, 2005. doi: 10.3748/wjg.v11.i15.2306
Published online Apr 21, 2005. doi: 10.3748/wjg.v11.i15.2306
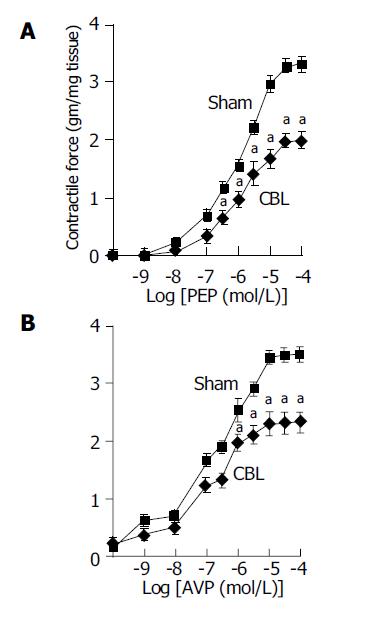
Figure 1 Maximum cumulative concentration-response curves to (A) phenylephrine (PEP) (10-10 to 10-4 mol/L), (B) AVP (10-10 to 10-4 mol/L) in thoracic aorta from CBL (◆) and sham (□) rats.
aP<0.05 vs sham rats (n = 12 in each group with different agonist stimulation). Sham: sham-operated rats; CBL: common bile duct-ligated rats.
- Citation: Lin HC, Yang YY, Huang YT, Lee TY, Hou MC, Lee FY, Lee SD. Vascular contractile response and signal transduction in endothelium-denuded aorta from cirrhotic rats. World J Gastroenterol 2005; 11(15): 2306-2312
- URL: https://www.wjgnet.com/1007-9327/full/v11/i15/2306.htm
- DOI: https://dx.doi.org/10.3748/wjg.v11.i15.2306


