Copyright
©2005 Baishideng Publishing Group Inc.
World J Gastroenterol. Apr 21, 2005; 11(15): 2277-2282
Published online Apr 21, 2005. doi: 10.3748/wjg.v11.i15.2277
Published online Apr 21, 2005. doi: 10.3748/wjg.v11.i15.2277
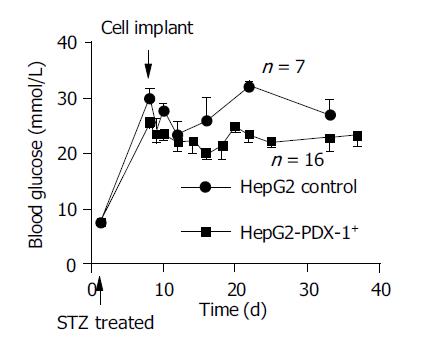
Figure 3 Blood glucose level of STZ-induced diabetic nude mice after implantation of PDX-1+ HepG2 cells under renal capsule.
Between 5×10⁶ and 1×10⁷ PDX-1+HepG2 cells or parental HepG2 cells were injected into subcapsular space. Blood glucose level was measured 0, 1, 2, 3, 5, 7, 9, 11, 13, 15, 18, 26, 30 d after operation. Values are expressed as mean±SD for each time point, PDX-1+HepG2 group (n = 16) vs HepG2 group (n = 7).
- Citation: Lu S, Wang WP, Wang XF, Zheng ZM, Chen P, Ma KT, Zhou CY. Heterogeneity in predisposition of hepatic cells to be induced into pancreatic endocrine cells by PDX-1. World J Gastroenterol 2005; 11(15): 2277-2282
- URL: https://www.wjgnet.com/1007-9327/full/v11/i15/2277.htm
- DOI: https://dx.doi.org/10.3748/wjg.v11.i15.2277


