Copyright
©2005 Baishideng Publishing Group Inc.
World J Gastroenterol. Apr 14, 2005; 11(14): 2080-2087
Published online Apr 14, 2005. doi: 10.3748/wjg.v11.i14.2080
Published online Apr 14, 2005. doi: 10.3748/wjg.v11.i14.2080
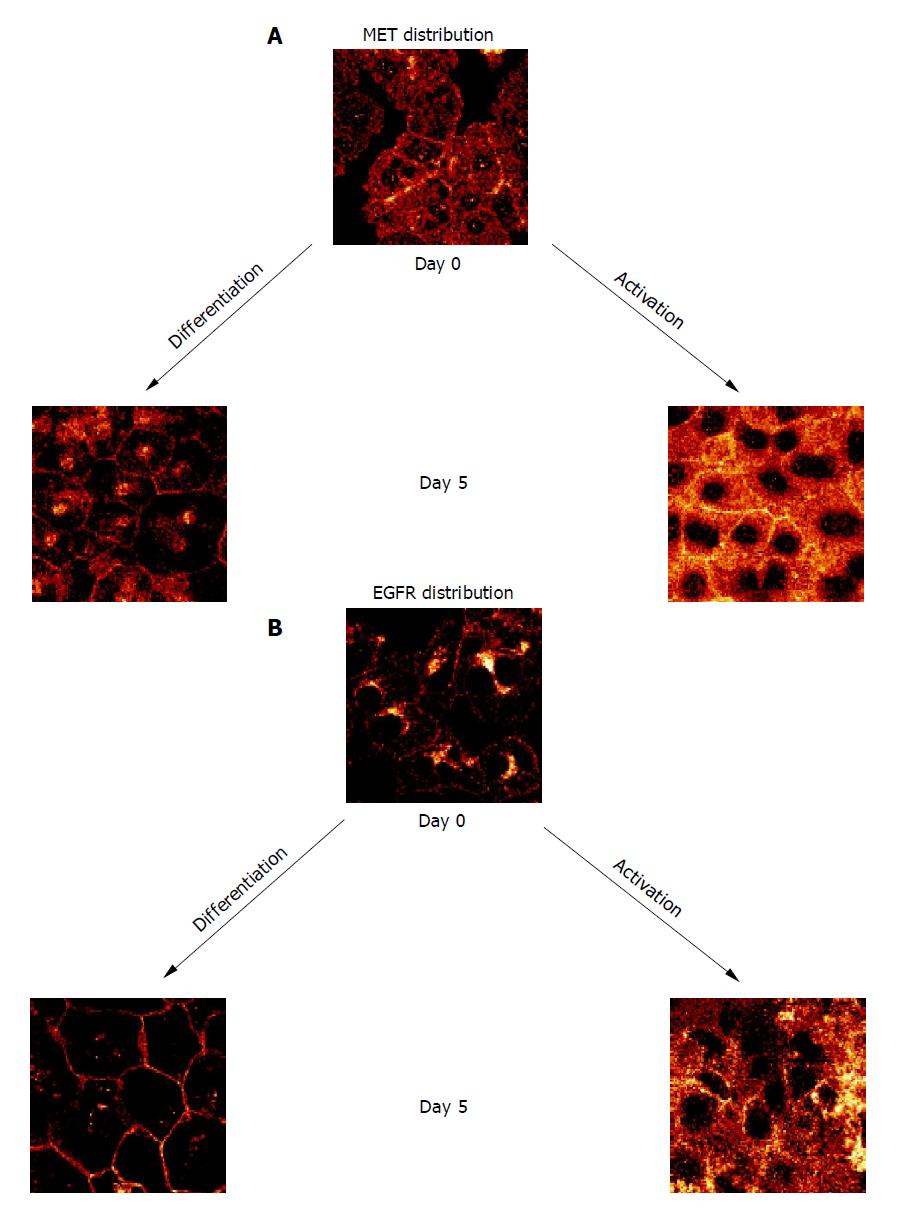
Figure 3 Confocal analysis of distribution pattern of growth factor receptors on d 0 and 5 after culture onset.
A: MET distribution; B: EGFR distribution. HC were cultured either in DM or in AM. Indocarbocyanine staining, ×100/1.3 oil immersion objective. Each figure is representative for three separate experiments.
- Citation: Auth MK, Boost KA, Leckel K, Beecken WD, Engl T, Jonas D, Oppermann E, Hilgard P, Markus BH, Bechstein WO, Blaheta RA. Controlled and reversible induction of differentiation and activation of adult human hepatocytes by a biphasic culture technique. World J Gastroenterol 2005; 11(14): 2080-2087
- URL: https://www.wjgnet.com/1007-9327/full/v11/i14/2080.htm
- DOI: https://dx.doi.org/10.3748/wjg.v11.i14.2080


