Copyright
©2005 Baishideng Publishing Group Inc.
World J Gastroenterol. Apr 7, 2005; 11(13): 1995-1999
Published online Apr 7, 2005. doi: 10.3748/wjg.v11.i13.1995
Published online Apr 7, 2005. doi: 10.3748/wjg.v11.i13.1995
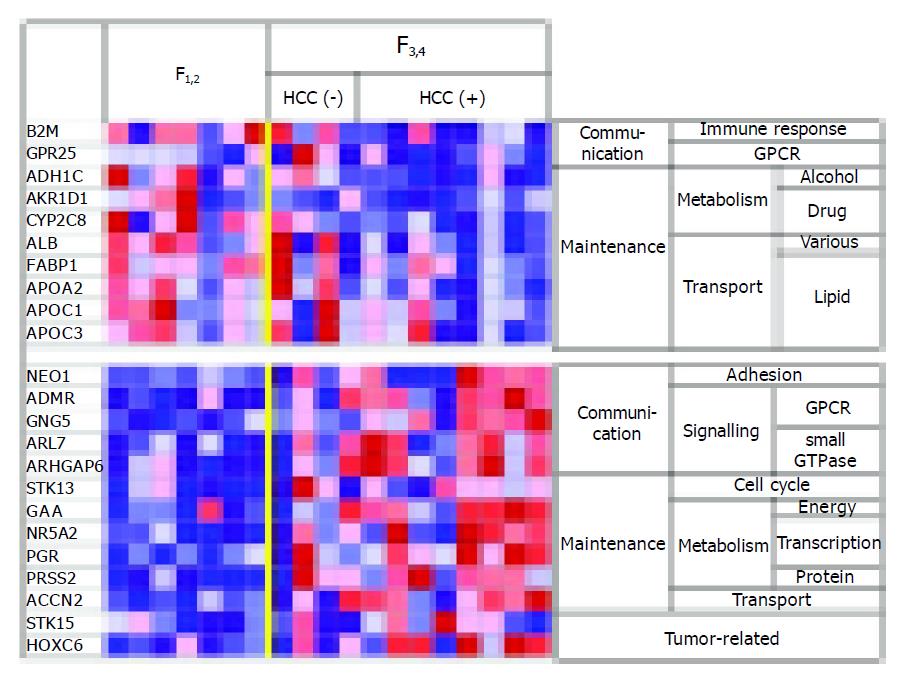
Figure 2 Genes expressed differentially between livers with F1-2 and F3-4 fibrosis.
The red and blue colors indicate relative extent of gene overexpression and underexpression, respectively, with darker colors indicating larger differences. GPCR, G protein-coupled receptor; HCC, hepatocellular carcinoma; B2M, beta-2-microglobulin; GRP25, G protein-coupled receptor 25; ADH1C, alcohol dehydrogenase 1C; AKR1D1, aldo-keto reductase 1D1; CYP2C8, cytochrome P450 2C8; ALB, albumin; FABP1, fatty acid binding protein 1; APO, apolipoprotein; NEO, neogenin homolog; ADMR, adrenomedullin receptor; GNG5, guanine nucleotide binding protein (G protein) gamma 5; ARL7, ADP-ribosylation factor-like 7; ARHGAP6, Rho GTPase activating protein 6; STK, serine/threonine kinase; GAA, glucosidase alpha acid; NR5A2, nuclear receptor subfamily 5A2; PGR, progesterone receptor; PRS2, protease serine 2; ACCN2, amiloride-sensitive cation channel 2; HOXC6, homeo box C6.
- Citation: Shao RX, Hoshida Y, Otsuka M, Kato N, Tateishi R, Teratani T, Shiina S, Taniguchi H, Moriyama M, Kawabe T, Omata M. Hepatic gene expression profiles associated with fibrosis progression and hepatocarcinogenesis in hepatitis C patients. World J Gastroenterol 2005; 11(13): 1995-1999
- URL: https://www.wjgnet.com/1007-9327/full/v11/i13/1995.htm
- DOI: https://dx.doi.org/10.3748/wjg.v11.i13.1995


