Copyright
©2005 Baishideng Publishing Group Inc.
World J Gastroenterol. Apr 7, 2005; 11(13): 1896-1902
Published online Apr 7, 2005. doi: 10.3748/wjg.v11.i13.1896
Published online Apr 7, 2005. doi: 10.3748/wjg.v11.i13.1896
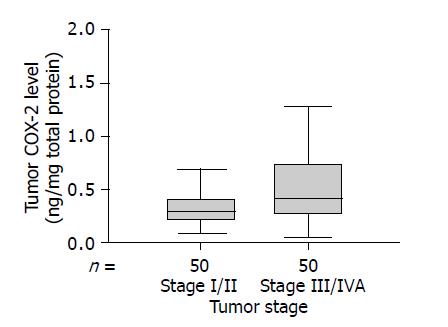
Figure 2 Boxplots showing significantly higher tumor COX-2 levels in patients with advanced tumor stage (III and IVA) compared with those with early tumor stage (I or II) (P = 0.
008). The upper and lower horizontal lines of the box indicate the 25th and 75th percentiles, respectively. The lines within the box indicate the median values. The upper and lower horizontal bars indicate data within 1.5 times the interquartile range.
- Citation: Tang TC, Poon RT, Lau CP, Xie D, Fan ST. Tumor cyclooxygenase-2 levels correlate with tumor invasiveness in human hepatocellular carcinoma. World J Gastroenterol 2005; 11(13): 1896-1902
- URL: https://www.wjgnet.com/1007-9327/full/v11/i13/1896.htm
- DOI: https://dx.doi.org/10.3748/wjg.v11.i13.1896


