Copyright
©2005 Baishideng Publishing Group Inc.
World J Gastroenterol. Mar 28, 2005; 11(12): 1837-1842
Published online Mar 28, 2005. doi: 10.3748/wjg.v11.i12.1837
Published online Mar 28, 2005. doi: 10.3748/wjg.v11.i12.1837
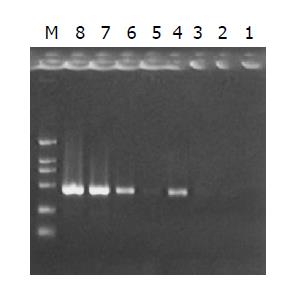
Figure 6 Analysis of subtration effect.
PCR was performed on subtracted (lanes 1-4) or unsubtracted (lanes 5-8) secondary PCR products with G3PDH 5’ primer and 3’ primer. Lanes 1, 5: 20 cycles; Lanes 2, 6: 25 cycles; Lanes 3, 7: 30 cycles; Lanes 4, 8: 35 cycles; M: DNA marker DL2000.
- Citation: Cui XN, Tang JW, Hou L, Song B, Li L, Liu JW. Screening differentially expressed genes in mouse hepatocarcinoma ascites cell line with high potential of lymphatic metastasis. World J Gastroenterol 2005; 11(12): 1837-1842
- URL: https://www.wjgnet.com/1007-9327/full/v11/i12/1837.htm
- DOI: https://dx.doi.org/10.3748/wjg.v11.i12.1837


