Copyright
©2005 Baishideng Publishing Group Inc.
World J Gastroenterol. Mar 28, 2005; 11(12): 1759-1763
Published online Mar 28, 2005. doi: 10.3748/wjg.v11.i12.1759
Published online Mar 28, 2005. doi: 10.3748/wjg.v11.i12.1759
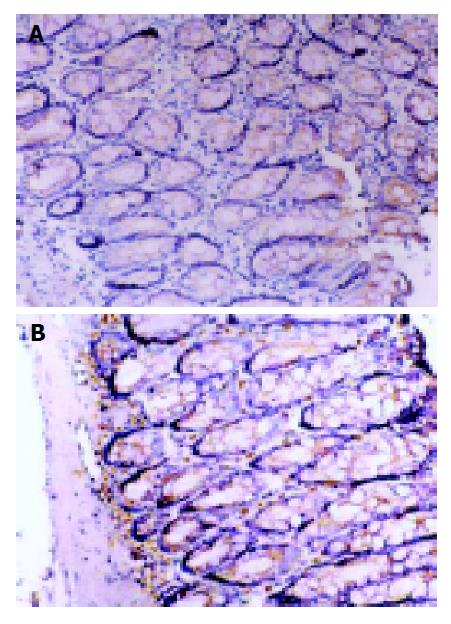
Figure 4 Immunohistochemical staining for TNF-α protein expression.
SP×200. A: TNF-α protein expression in normal group; B: TNF-α expression in model II group. The number of TNF-α immunoreactive positive cells in model group was significantly more than that of normal controls.
- Citation: Li JH, Yu JP, Yu HG, Xu XM, Yu LL, Liu SQ. Expression and significance of nuclear factor κB p65 in colon tissues of rats with TNBS-induced colitis. World J Gastroenterol 2005; 11(12): 1759-1763
- URL: https://www.wjgnet.com/1007-9327/full/v11/i12/1759.htm
- DOI: https://dx.doi.org/10.3748/wjg.v11.i12.1759


