Copyright
©2005 Baishideng Publishing Group Inc.
World J Gastroenterol. Mar 21, 2005; 11(11): 1571-1576
Published online Mar 21, 2005. doi: 10.3748/wjg.v11.i11.1571
Published online Mar 21, 2005. doi: 10.3748/wjg.v11.i11.1571
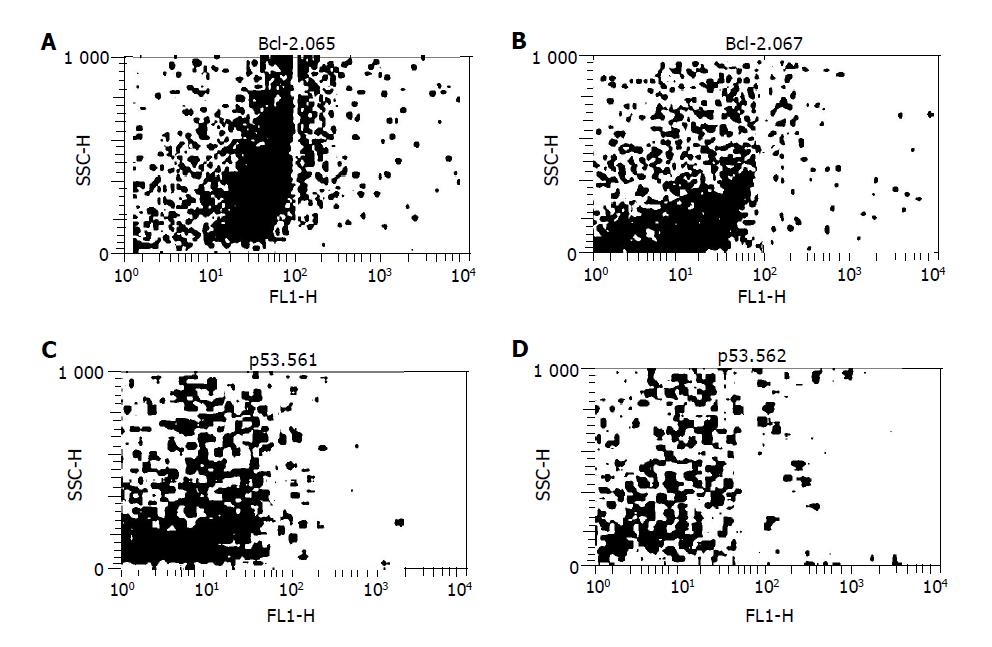
Figure 3 Flow cytometry analysis of Bcl-2 and p53 expression in a patient before and after folic acid treatment For Bcl-2 and p53 expression, cells were stained with FITC-labeled monoclonal anti-Bcl-2 (A and B) or anti-p53 antibodies (C and D); and then measured by flow cytometry.
A and C: before; B and D: after folic acid treatment. Representative results of one of the subjects are shown.
- Citation: Cao DZ, Sun WH, Ou XL, Yu Q, Yu T, Zhang YZ, Wu ZY, Xue QP, Cheng YL. Effects of folic acid on epithelial apoptosis and expression of Bcl-2 and p53 in premalignant gastric lesions. World J Gastroenterol 2005; 11(11): 1571-1576
- URL: https://www.wjgnet.com/1007-9327/full/v11/i11/1571.htm
- DOI: https://dx.doi.org/10.3748/wjg.v11.i11.1571


