Copyright
©2005 Baishideng Publishing Group Inc.
World J Gastroenterol. Mar 14, 2005; 11(10): 1521-1528
Published online Mar 14, 2005. doi: 10.3748/wjg.v11.i10.1521
Published online Mar 14, 2005. doi: 10.3748/wjg.v11.i10.1521
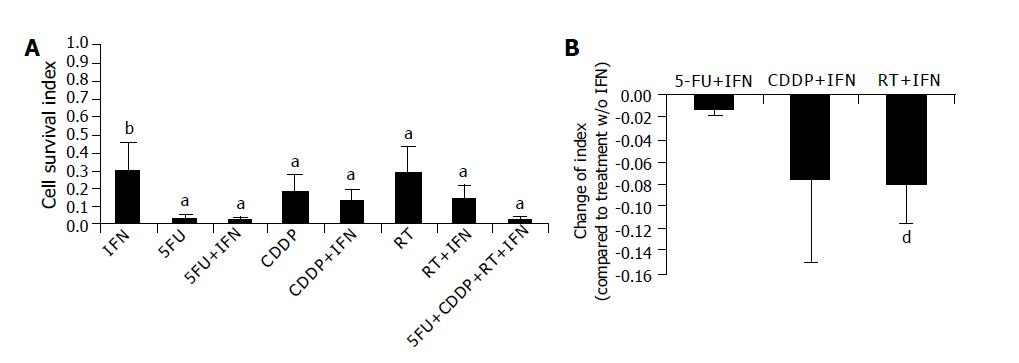
Figure 1 Influence on cell survival Equal amount of cells were seeded out on day +1.
A: Numbers of viable cells were determined after five-day treatment. Cell numbers of untreated cells were set to ‘1’ and cell survival index was calculated. B: Shows the influence of IFN-α in combination treatments. Values of treatments without IFN-α were subtracted from values after combination treatment. Data is shown as mean±SD error from eight cell lines with at least three separate experiments. aP<0.05 was labeled with an asterisk; bP<0.01 with two asterisks and dP<0.001 with three asterisks.
- Citation: Ma JH, Patrut E, Schmidt J, Knaebel HP, Büchler MW, Märten A. Synergistic effects of interferon-alpha in combination with chemoradiation on human pancreatic adenocarcinoma. World J Gastroenterol 2005; 11(10): 1521-1528
- URL: https://www.wjgnet.com/1007-9327/full/v11/i10/1521.htm
- DOI: https://dx.doi.org/10.3748/wjg.v11.i10.1521


